12 Things That Became Even More Costly in 2020

Woman holding an empty wallet
9nong / Shutterstock.com

What goes up doesn’t usually come down, at least when it comes to consumer prices.

According to the U.S. Bureau of Labor Statistics’ Consumer Price Index, a common gauge for inflation, prices increased by 1.4% overall from December 2019 to December 2020.

Here’s a look, in no particular order, at some goods and services that saw price hikes in 2020 or that increased in price over the course of last year.

Need some good news? Try “7 Things That Got Cheaper Last Year.”

1. Eating out

Yulia Grigoryeva / Shutterstock.com

If you managed to do any dining out last year, you probably paid a bit more. According to the BLS Consumer Price Index report for December 2020, the cost of dining out rose 3.9% from December 2019.

That’s bigger than the 3.1% increase we saw over the course of 2019 and the 2.8% increase for 2018.

If your budget is feeling the pinch, check out “A Former Restaurant Critic Shares Her 11 Best Tips for Dining Out Cheaply but Well.”

2. Cable TV

Blackregis / Shutterstock.com

Spectrum, Comcast, Dish and AT&T are among the cable TV providers that hiked their prices for 2020, according to Cord Cutters News.

Spoiler alert: You can expect much of the same this year, as we detail in “3 Cable TV Companies Hiking Prices for 2021.”

3. Streaming TV

tommaso79 / Shutterstock.com

It’s not just cable: Streaming TV also has gotten more expensive. YouTube TV, Netflix, and Hulu for example, hiked their prices in 2020.

Perhaps it’s time to check out free movie streaming.

4. Priority Mail

B Brown / Shutterstock.com

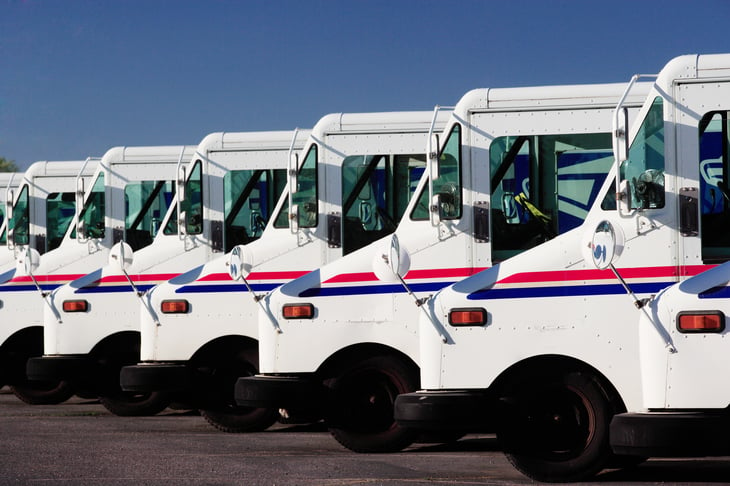
The U.S. Postal Service’s prices for numerous Priority Mail flat rates increased in January 2020. The cost of mailing a 1-ounce international letter also increased, by 5 cents to $1.20.

More bad news: USPS kicked off 2021 with another round of price hikes for certain shipping and mailing services, as we recently reported.

5. College tuition and fees

Flamingo Images / Shutterstock.coms

The College Board says the average sticker price for tuition and fees for full-time students increased by as much as 2.1% between the 2019-2020 and 2020-2021 school years. As of the 2020-2021 school year, it averaged:

  • $10,560 at public four-year in-state schools — which is 1.1% higher than in 2019-2020, before adjusting for inflation
  • $27,020 at public four-year out-of-state schools — 0.9% higher
  • $3,770 at public two-year in-district schools — 1.9% higher
  • $37,650 at private nonprofit four-year schools — 2.1% higher

Feeling overwhelmed? Check out “10 Colleges Where Tuition Is Free” and, if you’re 60 or older, “10 Colleges That Offer Free Tuition for Seniors.”

6. Traditional Medicare

Syda Productions / Shutterstock.com

At the start of 2020, the Medicare Part B standard premium rose by $9.10 per month and the deductible rose by $13 per year. The Part A annual inpatient hospital deductible increased by $44.

This year, these same Medicare deductibles and premiums have increased again, although the increases were smaller for Part B, as we reported.

7. Groceries

goodluz / Shutterstock.com

The coronavirus pandemic created numerous grocery supply chain issues, which led to higher prices for consumers.

The price of groceries increased 3.9% overall from December 2019 to December 2020, according to the Bureau of Labor Statistics’ Consumer Price Index. Compare that with increases of only 0.6%, 0.7% and 0.9% in each of the prior three years.

Grocery categories that saw even higher increases last year include:

  • Meats, poultry, fish and eggs: 4.6%
  • Dairy and related products: 4.4%

If your wallet could use some relief, check out “13 Unusual but Effective Ways to Save on Groceries.”

8. Stocks

Rawpixel.com / Shutterstock.com

What coronavirus correction? Stocks recovered shortly after the March 2020 drop and went on to reach new records last year.

The S&P 500 stood at around 3,701 points on Jan. 4, 2021, up from about 3,258 points at the start of 2020. The Dow Jones Industrial Average stood at around 31,098 points at the start of 2021 — up from about 28,824 points one year earlier.

9. Credit card late fees

antoniodiaz / Shutterstock.com

The federally allowed thresholds for credit card late payment penalties rose by $1 at the start of 2020, as we detailed in “2 Credit Card Late Fee Amounts Increased for 2020.” These thresholds are now:

  • First late payment penalty: $29
  • Subsequent late payment penalty: $40

On the bright side, for a change, these fees did not increase at the start of 2021.

10. New cars

AboutLife / Shutterstock.com

The average cost for that “new car smell” went up 1.3% in 2020, according to Kelley Blue Book.

The news was much worse for used vehicles …

11. Used cars

Driver with car window down to avoid the coronavirus
SpeedKingz / Shutterstock.com

Used car and truck prices rose a whopping 10% between December 2019 and December 2020, according to the BLS Consumer Price Index. That is the largest December-to-December increase reported for that index since 1983.

12. Cigarettes

Ashtray
gloverk / Shutterstock.com

Smokers paid 5.4% more for cigarettes in December 2020 than in December 2019, the BLS Consumer Price Index shows.

Disclosure: The information you read here is always objective. However, we sometimes receive compensation when you click links within our stories.

Fortune 500 Companies That Hire Remote Workers

remote worker virtual meeting
insta_photos / Shutterstock.com


This story originally appeared on FlexJobs.com.

With 42% of the U.S. workforce continuing to work from home full-time, businesses of all sizes — from small startups to major corporations — are hiring workers for remote and flexible jobs. And even though some companies may have employees return to the office, many are switching to a long-term remote working model.

Fortune 500 companies, in many instances, are leading the way when it comes to hiring remote workers.

To help you with your work-from-home job search, we’re highlighting some of the biggest corporations in the U.S. that commonly hire for remote jobs. These companies have also been featured in the FlexJobs list of the Top 100 Companies for Remote Jobs in 2021.

1. Amazon

Amazon sign
Sundry Photography / Shutterstock.com

Amazon is the world’s largest online retailer. Through its online marketplace, the company offers traditional books and e-books, furniture, household items, apparel, electronics, music, movies, and a vast selection of other products.

Recent remote jobs:

  • Life Sciences Business Development
  • Executive Intelligence and Messaging Leader
  • Healthcare and Life Sciences Program Manager

2. Anthem

Anthem company sign
Ken Wolter / Shutterstock.com

Anthem is the nation’s largest nonprofit managed healthcare company, serving one in nine Americans. Headquartered in Indianapolis, Indiana, Anthem delivers services and products that help members receive the care they need to live a healthy life.

Recent remote jobs:

  • Customer Care Representative
  • Referral Specialist

3. Cisco

Cisco Sign
Sundry Photography / Shutterstock.com

Cisco is an award-winning, publicly-traded global technology solutions firm. Established in 1984 by a group of computer scientists from Stanford University, Cisco has become a powerhouse of internet and communications products, services, and solutions that have revolutionized the way business is conducted.

Recent remote jobs:

  • Senior Solutions Marketing Manager
  • DevNet Programmability Content Engineer

4. Citizens Bank

Citizens Bank Sign
JHVEPhoto / Shutterstock.com

Citizens Bank is one of the oldest financial institutions in the U.S. Now the 13th-largest bank, the company offers individuals and businesses a broad range of financial and banking solutions.

Recent remote jobs:

  • Payments Platform Experience Owner
  • Home Mortgage Closing Specialist
  • Senior Business Development Officer

5. CVS Health

CVS
Jonathan Weiss / Shutterstock.com

CVS Health is the nation’s largest provider of healthcare services and prescriptions, fulfilling over 1 billion annual prescriptions. CVS Health manages over 9,500 pharmacy stores, a thriving online pharmacy, and 1,100 MinuteClinic locations, serving an average of 5 million customers every day.

Recent remote jobs:

  • Compliant Appeal
  • Business Data Coordinator
  • Utilization Management Nurse Consultant Registered Nurse

6. Dell Technologies

Dell Technologies
Ken Wolter / Shutterstock.com

With dozens of offices throughout the United States and abroad, Dell Technologies is a PC vendor widely recognized for its software, personal computers, printers, cameras, MP3 players, HDTVs, and more. Employing more than 103,000 professionals around the world, Dell Technologies is regarded as one of the world’s largest technology companies.

Recent remote jobs:

  • Market Development Consultant
  • Technical Account Management Consultant

7. General Dynamics Information Technology

General Dynamics Information Technologies
Michael Vi / Shutterstock.com

General Dynamics Information Technology offers leading, mission-critical IT enterprise solutions to clients worldwide. The company’s specializations include modernized and responsive systems, operational continuity, flexible technology, robust security, and remote video surveillance.

Recent remote jobs:

  • Technical Writer
  • Senior Appian Developer – DevSecOps
  • Java Software Developer

8. Humana

Humana sign
Katherine Welles / Shutterstock.com

Representing over 13.8 million medical members nationwide, Humana is a leading healthcare company and the nation’s third-largest health insurance provider. Humana offers a variety of health, wellness, and insurance products and services.

Recent remote jobs:

  • Pharmacy Proposal Technical Writer
  • Director of Health Services
  • Pharmacist

9. IQVIA

IQVIA Logo
Konektus Photo / Shutterstock.com

IQVIA employs over 50,000 professionals around the world who are committed to helping clients improve their scientific, commercial, and clinical results.

Recent remote jobs:

  • Senior Clinical Medical Writer – Medical Devices
  • Clinical Phone Support Specialist

10. Leidos

Leidos Sign
JHVEPhoto / Shutterstock.com

Leidos provides services for organizations in the criminal justice, cybersecurity, financial, geospatial, life sciences, software development, and aeronautics and space fields. The company’s products include software, sensors, and non-destructive imaging.

Recent remote jobs:

  • Senior Project Scheduler
  • Senior Payroll Specialist
  • Software Engineer

11. McKesson Corporation

McKesson Corporation
Piotr Swat / Shutterstock.com

McKesson helps clients overcome their operational, financial, and clinical performance through business and clinical services, healthcare information technology, and pharmaceutical and medical-surgical supply management.

Recent remote jobs:

  • Biostatistician
  • Outcomes Researcher
  • Clinical Healthcare Data Analyst

12. Motorola Solutions

Motorola Solutions
Jan Orlowski / Shutterstock.com

Motorola Solutions creates top-quality, value-conscious products for consumers around the world.

Recent remote jobs:

  • Data Integrator
  • Security Engineer

13. Oracle

Oracle
Sundry Photography / Shutterstock.com

Oracle is a cloud application and platform service company offering comprehensive and fully integrated cloud applications, platforms, and engineered methods.

Recent remote jobs:

  • Employer Branding Creative Writer
  • Senior Digital Marketing Analyst
  • Principal Software Engineer

14. Robert Half International

Robert Half
Casimiro PT / Shutterstock.com

Robert Half International is a global professional staffing and consulting firm. The company owns and manages staffing and consulting operations in over 400 locations around the globe.

Recent remote jobs:

  • Microsoft Access Developer
  • Augmented Reality Developer

15. Salesforce

Salesforce sign
Bjorn Bakstad / Money Talks News

Salesforce helps businesses of all sizes and from all industries contact their customers through Salesforce’s customer relationship management platform.

Recent remote jobs:

  • Data Engineer
  • Senior Manager – Director, Software Engineering

16. Stryker

Stryker Building
Sundry Photography / Shutterstock.com

Stryker provides medical devices for the medical technology industry. The company’s broad range of innovative technologies helps people become more active so they can lead healthier lives.

Recent remote jobs:

  • Senior Software Engineer
  • Software Engineer

17. Thermo Fisher Scientific

Thermo Fisher Scientific
Michael Vi / Shutterstock.com

Thermo Fisher Scientific is a global biotechnology product development company that offers innovative technologies, purchasing convenience, and comprehensive support. With annual revenues over $17 billion, Thermo Fisher Scientific is a global leader in science.

Recent remote jobs:

  • Account Manager, Analytical Instrument and Equipment Services
  • Demand Planner
  • Technical Sales Specialist – High Content Screening

18. UnitedHealth Group

Unitedhealthcare sign
Ken Wolter / Shutterstock.com

Headquartered in Minneapolis, Minnesota, UnitedHealth Group is a healthcare company made up of two businesses: UnitedHealthcare, a benefits and insurance coverage provider, and Optum, a technology and information-enabled health services provider.

Recent remote jobs:

  • Developer
  • Telephonic Fertility RN Case Manager
  • Associate Director of Business Analysis

19. USAA

Casimiro PT / Shutterstock.com

USAA offers a fully integrated array of financial services to active and former U.S. military members and their families. The company’s services include banking, investments, credit cards, loans, and insurance.

Recent remote jobs:

  • Decision Science Analyst Senior, Omnichannel Analytics
  • Senior IT Risk Analyst – Governance

20. Wells Fargo

Wells Fargo sign
Roman Tiraspolsky / Shutterstock.com

Founded in 1852 and with more than 22,000 domestic and international branches, Wells Fargo is a community-based financial services company providing banking, insurance, investments, mortgages, and consumer and business finance services.

Recent remote jobs:

  • Mortgage Loan Processor
  • Conforming Mortgage Underwriter

Disclosure: The information you read here is always objective. However, we sometimes receive compensation when you click links within our stories.

America’s Most Sleep-Deprived Cities

tired sleepy woman
file404 / Shutterstock.com

This story originally appeared on RetailMeNot.

When it comes to health and wellness, most people tend to focus on eating right, exercising regularly, and fostering mental and social emotional well-being. But one oft-overlooked ingredient in the wellness mix is sleep, and poor sleep can undermine other efforts at healthy living.

The science on sleep is clear: Sleep deprivation is associated with a variety of other health concerns, including diabetes, cardiovascular disease, hypertension, obesity, and depression. Further, the relationship between sleep and these conditions is often cyclical: People find it harder to sleep because of health issues, and health issues can be more difficult to manage when sleep is insufficient. On top of that, poor sleep also leads to car crashes, industrial errors, and other accidents that can cause serious injury.

Despite the importance of good sleep, a large number of U.S. residents do not report getting the rest they need each night. The Centers for Disease Control and Prevention estimates that 70 million Americans experience insufficient sleep, defined as seven hours or less each night. In 2013, the CDC declared that this level of sleeplessness constituted a public health epidemic.

Factors Contributing to Poor Sleep

Elnur / Shutterstock.com

Many facets of modern life contribute to the lack of sleep. One example is technology, as people spend more time in front of brightly-lit devices that disrupt the body’s natural circadian rhythms. But more fundamental patterns of working and living are also at play. Factors like longer commutes and longer working hours in the U.S. workforce may be key reasons why a good night’s rest is harder to come by. This is likely the case in the country’s most sleep-deprived state of Hawaii, where health experts attribute poor sleep to the fact that residents often work longer hours or multiple jobs to deal with the state’s high cost of living. Luckily for most Hawaiians, however, the island lifestyle does not tend to produce the same negative physical and mental health outcomes as seen in other sleep-deprived states.

Another major contributing factor in sleep deprivation is poverty. Poverty is highly correlated both with sleep quality and the aforementioned health problems related to sleep. Poor families’ difficulty accessing resources like nutritious food or safe, affordable housing means that they often do not have behaviors or environments conducive to good sleep. Their precarious economic position also creates heightened levels of stress, which has mental and physiological effects that make it more difficult to sleep. This is why, in part, most of the states and cities where residents report the highest levels of sleeplessness are found in economically distressed parts of the Rust Belt, Appalachia, and the South.

To identify the U.S. locations that are most sleep-deprived, researchers at RetailMeNot evaluated data from the CDC to identify the cities and states where the most adults reported receiving seven hours or less of sleep each night. Their researchers also included other closely related indicators in their analysis, including the share of adults reporting poor physical and mental health outcomes and the local poverty rate.

Here are the large cities that are most sleep-deprived.

15. Las Vegas, NV

Las Vegas by night, with mountains
egd / Shutterstock.com
  • Percentage of adults who sleep less than 7 hours per night: 38.6%
  • Percentage of adults reporting poor physical health: 14.9%
  • Percentage of adults reporting poor mental health: 14.8%
  • Poverty rate: 14.9%

14. Houston, TX

Houston at dusk
By Silvio Ligutti / Shutterstock.com
  • Percentage of adults who sleep less than 7 hours per night: 38.6%
  • Percentage of adults reporting poor physical health: 14.0%
  • Percentage of adults reporting poor mental health: 13.5%
  • Poverty rate: 19.7%

13. Milwaukee, WI

Milwaukee, Wisconsin
f11photo / Shutterstock.com
  • Percentage of adults who sleep less than 7 hours per night: 38.7%
  • Percentage of adults reporting poor physical health: 16.9%
  • Percentage of adults reporting poor mental health: 15.8%
  • Poverty rate: 22.4%

12. Nashville, TN

Nashville, Tennessee
jdross75 / Shutterstock.com
  • Percentage of adults who sleep less than 7 hours per night: 38.7%
  • Percentage of adults reporting poor physical health: 13.9%
  • Percentage of adults reporting poor mental health: 15.1%
  • Poverty rate: 12.6%

11. Louisville, KY

Louisville, Kentucky
f11photo / Shutterstock.com
  • Percentage of adults who sleep less than 7 hours per night: 38.8%
  • Percentage of adults reporting poor physical health: 12.6%
  • Percentage of adults reporting poor mental health: 15.5%
  • Poverty rate: 15.4%

10. Oklahoma City, OK

Oklahoma City, Oklahoma
Austin Urton / Shutterstock.com
  • Percentage of adults who sleep less than 7 hours per night: 38.9%
  • Percentage of adults reporting poor physical health: 14.1%
  • Percentage of adults reporting poor mental health: 15.6%
  • Poverty rate: 15.8%

9. Miami, FL

Miami, Florida
littleny / Shutterstock.com
  • Percentage of adults who sleep less than 7 hours per night: 39.6%
  • Percentage of adults reporting poor physical health: 15.8%
  • Percentage of adults reporting poor mental health: 15.0%
  • Poverty rate: 20.3%

8. Jacksonville, FL

Jacksonville, Florida
Sean Pavone / Shutterstock.com
  • Percentage of adults who sleep less than 7 hours per night: 40.4%
  • Percentage of adults reporting poor physical health: 13.9%
  • Percentage of adults reporting poor mental health: 15.8%
  • Poverty rate: 14.1%

7. New York, NY

New York City coastline
IM_photo / Shutterstock.com
  • Percentage of adults who sleep less than 7 hours per night: 40.5%
  • Percentage of adults reporting poor physical health: 12.2%
  • Percentage of adults reporting poor mental health: 12.7%
  • Poverty rate: 16.0%

6. Columbus, OH

Columbus, Ohio
Randall Vermillion / Shutterstock.com
  • Percentage of adults who sleep less than 7 hours per night: 41.8%
  • Percentage of adults reporting poor physical health: 12.6%
  • Percentage of adults reporting poor mental health: 15.1%
  • Poverty rate: 16.3%

5. Baltimore, MD

Baltimore, Maryland
sean-pavone / Shutterstock.com
  • Percentage of adults who sleep less than 7 hours per night: 44.2%
  • Percentage of adults reporting poor physical health: 13.7%
  • Percentage of adults reporting poor mental health: 15.3%
  • Poverty rate: 20.2%

4. Philadelphia, PA

Philadelphia, Pennsylvania at dusk
f11photo / Shutterstock.com
  • Percentage of adults who sleep less than 7 hours per night: 45.4%
  • Percentage of adults reporting poor physical health: 15.2%
  • Percentage of adults reporting poor mental health: 18.0%
  • Poverty rate: 23.3%

3. Memphis, TN

Street scene, Memphis, Tennessee.
f11photo / Shutterstock.com
  • Percentage of adults who sleep less than 7 hours per night: 47.8%
  • Percentage of adults reporting poor physical health: 17.6%
  • Percentage of adults reporting poor mental health: 17.9%
  • Poverty rate: 21.7%

2. Cleveland, OH

Cleveland, Ohio
rudy-balasko / Shutterstock.com
  • Percentage of adults who sleep less than 7 hours per night: 50.3%
  • Percentage of adults reporting poor physical health: 18.5%
  • Percentage of adults reporting poor mental health: 19.4%
  • Poverty rate: 30.8%

1. Detroit, MI

Jason Grindle / Shutterstock.com
  • Percentage of adults who sleep less than 7 hours per night: 51.4%
  • Percentage of adults reporting poor physical health: 20.7%
  • Percentage of adults reporting poor mental health: 19.0%
  • Poverty rate: 30.6%

Methodology & Detailed Findings

shevdinov1 / Shutterstock.com

The data used in this analysis is from the Centers for Disease Control and Prevention’s PLACES 2020 Release. To identify the most sleep-deprived locations, researchers ranked cities and states based on the percentage of adults who reported usually getting less than seven hours of sleep in a 24-hour period. Researchers also included data on physical and mental health — adults who report 14 or more days in a month in which their physical or mental health was not good. To improve relevance, only cities with at least 100,000 residents were included. Additionally, cities were grouped into cohorts based on population: small (100,000–149,999), midsize (150,000–349,999), and large (350,000 or more).

Disclosure: The information you read here is always objective. However, we sometimes receive compensation when you click links within our stories.

21 Pharmacy Chains Ready to Give COVID-19 Vaccines

COVID vaccinationCOVID vaccination
Prostock-studio / Shutterstock.com

After a miserable year in the dark night of a pandemic, a new day is about to dawn.

Millions of Americans have received the vaccine against COVID-19, the disease caused by the coronavirus. And the rest of us will have our opportunity soon.

If you can’t wait to get the shot — and to return to normal life — you’ll want to bookmark this story. Following is a list of pharmacies participating in the Federal Retail Pharmacy Program for COVID-19 Vaccination.

The program is a collaboration that includes the federal government, states and territories, and 21 national pharmacy partners and independent pharmacy networks.

Right now, the program is slowly rolling out to select pharmacy locations that are vaccinating eligible individuals. Eventually, more than 40,000 pharmacies will administer the vaccine to everyone who wants it.

Walmart and Sam’s Club

QualityHD / Shutterstock.com

Both the retail giant and its affiliated warehouse club are ready to begin vaccinating Americans.

On Feb. 2, Walmart said select pharmacies at retailer locations in 22 states would begin administering the vaccine once doses are available late next week. According to Walmart:

“Once our locations have received the vaccines, eligible customers and members can reserve a convenient vaccine appointment directly via a scheduling tool on the Walmart and Sam’s Club websites, while allocation lasts. In addition to appointments, the scheduler will provide a digital reminder when it’s time to return for the second dose of the vaccine in order for the vaccine to be fully effective.”

Walmart already is vaccinating patients in states where it has agreements with local governments.

The states in which Walmart will be a federal pharmacy partner are Alabama, Alaska, Arkansas, Colorado, Florida, Georgia, Idaho, Indiana, Kansas, Louisiana, Maine, Minnesota, Mississippi, Missouri, Nebraska, Nevada, Oklahoma, South Dakota, Tennessee, Texas, Utah and Wyoming.

For more information: Visit Walmart’s COVID-19 vaccine page.

Walgreens

Ken Wolter / Shutterstock.com

Walgreens will begin its vaccination efforts as part of the Federal Retail Pharmacy Program for COVID-19 Vaccination on Feb. 12.

Initially, 15 states and jurisdictions will participate: Chicago, Connecticut, Delaware, Illinois, Kentucky, Maryland, New Hampshire, New Mexico, New York, New York City, North Carolina, Puerto Rico, Vermont, Wisconsin and West Virginia.

The pharmacy chain already has been vaccinating people in states where it has reached agreements with local governments.

For more information: Visit Walgreens’ COVID-19 vaccine page.

CVS

CVSCVS
Jonathan Weiss / Shutterstock.com

On Feb. 11, certain CVS locations in 11 states will begin giving the vaccine to eligible populations. CVS expects the initial supply to be about 250,000 total doses. According to CVS:

“More than 90,000 health care professionals including pharmacists, licensed pharmacy technicians, and nurses will participate in the vaccination effort, giving CVS Pharmacy the capacity to administer 20-25 million shots per month.”

States where CVS will roll out its vaccination efforts are California, Connecticut, Hawaii, Maryland, Massachusetts, New Jersey, New York, Rhode Island, South Carolina, Texas and Virginia.

CVS is also working directly with Indiana and Ohio to provide some vaccinations.

For more information: Visit CVS’ COVID-19 resource center.

Kroger and related pharmacies

RalphsRalphs
Ken Wolter / Shutterstock.com

The Kroger Co. announced in late December that it would partner with federal and state governments to offer the COVID-19 vaccine across its 2,200 pharmacies and 220 clinics. (The company’s other chains include Fred Meyer, Harris Teeter and Ralphs, among others.)

In January, Kroger said pharmacies at its Ralphs grocery stores had begun giving the vaccine to health care personnel in Southern California.

As of Feb. 3, pharmacies that are part of the Kroger family had received “a limited supply of the COVID-19 vaccine in select areas,” Kroger said, and the company will update its “COVID-19 Vaccine Availability” webpage regularly.

For more information: Visit Kroger’s COVID-19 vaccinations page.

Publix

Boofoto / Shutterstock.com

Publix already has rolled out vaccinations in locations in Florida, Georgia and South Carolina. There is no word yet on when or how Publix plans to expand its vaccination efforts in the near future.

For more information: Visit Publix’s COVID-19 vaccine page.

Costco

Costco Wholesale exteriorCostco Wholesale exterior
Jonathan Weiss / Shutterstock.com

The warehouse club giant issued an announcement in late January that simply says it will begin offering the vaccine at its pharmacies “as soon as they are available, in accordance with CDC and state guidelines.”

Costco urges you not to contact your local Costco pharmacy, as such locations will not be able to schedule an appointment at this time.

For more information: Costco’s announcement directs people to visit the Centers for Disease Control and Prevention website or their state department of health website to learn more about vaccine availability in their area and their eligibility for the vaccine.

Others

Senior woman getting vaccineSenior woman getting vaccine
Image Point Fr / Shutterstock.com

Many other pharmacies — from Rite Aid to much smaller pharmacy chains — are participating in the Federal Retail Pharmacy Program for COVID-19 Vaccination. There are 21 chains in all. For a full list, visit the website of the Centers for Disease Control and Prevention.

Disclosure: The information you read here is always objective. However, we sometimes receive compensation when you click links within our stories.

8 Signs That It’s Time for You to Unretire

Older worker
Chaay_Tee / Shutterstock.com

After spending decades in the workplace, retirement may sound attractive. But many people develop second thoughts soon after leaving their jobs.

Just because someone is 65 or older doesn’t mean they’re ready to stop working. Some people miss their workplace colleagues and the sense of purpose that came from holding a job.

“If you’re an energetic person who wants to feel alive, you’re not going to feel happy sitting back and watching TV in retirement,” said Liliane Choney, executive director of ReVisions Resources, a nonprofit organization that helps seniors live independently.

If you’re motivated and in good health, returning to work is often the right thing to do. Here are some signs that it is time to unretire.

1. You’re having trouble making ends meet

Older man looking at documents, with surprised expression,
Prostock-studio / Shutterstock.com

Many people have trouble saving enough money to finance their retirement. Typically, Social Security benefits don’t provide enough income to maintain your lifestyle in retirement. Also, if you had children late in life, you may even face college expenses after leaving work.

One solution is to work a few years longer. That way, you can boost your income and gain more time to save money. Each year spent on the job means one less year you’ll need to rely on savings during retirement.

2. You’re becoming too sedentary

goodluz / Shutterstock.com

One benefit of going back to work is that it may improve your health. According to the journal Occupational and Environmental Medicine, many published studies suggest a connection between job satisfaction and good health.

Idle people are more prone to illness. Some retirees are able to replace work activities with pastimes that keep them active, but not everyone is good at making the transition.

A study of individuals age 50 and older by the Harvard School of Public Health found that those who had stopped working were 40% more likely to have heart attacks or strokes than those who continued their careers.

3. You can’t adjust to your new life

A man scratches his head while trying to think
Cameron Whitman / Shutterstock.com

Adjusting to life without a work schedule can be difficult. Some people pursue hobbies in retirement or fill their time with travel. But not everyone enjoys such activities.

If you’re bored and unhappy without a work schedule, you might be better off rejoining the workforce. For some, the right solution is going back to work part time, says economist Eric Tyson. This helps people gradually adjust to life in retirement.

4. You’ve lost social connections

work stress
pathdoc / Shutterstock.com

Losing relationships with work colleagues can leave you feeling lost and lonely.

Researchers at the University of Chicago have found that loneliness and feelings of isolation can trigger physiological changes that increase the risk of premature death in older persons by 14%.

Isolation can disrupt sleep, raise blood pressure and increase stress. If you miss work colleagues and have trouble making new friends, going back to work could make you happier.

5. You love being in the workplace

pikselstock / Shutterstock.com

If you were lucky enough to enjoy what you did for a living, it’s understandable that you’d want to return to the workplace. Some people don’t realize how much they like working until they stop, says Tyson.

After retirement, you may find yourself longing for old work activities — even the ones you didn’t appreciate before retiring.

6. You’re ready to start over in the workplace

ESB Professional / Shutterstock.com

Returning to work after retirement is a challenge. Once you’re out of the workplace, it can be hard to get back in, so you need to be highly motivated.

You may face age discrimination. Among older workers surveyed by AARP, not getting hired is the most common type of age discrimination they have experienced.

If you have been retired a year or longer, be prepared to address the “employment gap” on your resume. This may cause potential employers to question your dedication or willingness to remain on the job for a reasonable period of time.

“If you tell people, ‘I wanted to retire, but then I realized I missed working,’ employers are open to that,” says Tyson.

7. You have a great idea for a new business

older worker
michaeljung / Shutterstock.com

If you have decades of valuable experience working for others, now may be the time to put it to use for yourself by starting a business.

If you have a genuinely good idea for a business, age should be no barrier. Your business plan should explain why your idea is a good one, how the business will operate and what your anticipated expenses and earnings will be. Just be cautious.

“You have to really be mindful of whether you have the experience to do it and how realistic [the idea] is,” Choney says.

8. It’s time to pursue your passion

seniors
pikselstock / Shutterstock.com

Young adults raising families are reluctant to abandon the security of steady jobs to pursue risky careers, even if that is where their passions lie.

Once you have a secure retirement income from Social Security benefits, investments and/or a pension, you gain the freedom to take a chance on a passion-driven career — such as chef, artist or performer.

Disclosure: The information you read here is always objective. However, we sometimes receive compensation when you click links within our stories.

The 10 Most Popular Home Improvements Amid COVID-19

Senior couple painting the walls of their home
Halfpoint / Shutterstock.com

Spending on home improvements grew in 2020, driven both by higher costs for labor and materials and by homeowners’ shifting priorities amid the coronavirus pandemic.

Spending averaged $8,305 — up by $745 from 2019, according to HomeAdvisor’s latest annual State of Home Spending report.

The report is based on a poll of 5,000 Americans. It finds that homeowners are funding improvements in part with money once spent on travel, restaurant dining, entertainment and commuting.

The following home improvements are the most popular of 2020, HomeAdvisor says.

10. Deck or porch

Santiago Cornejo / Shutterstock.com

Households that did this type of project in 2020: 14%

Adding a deck is among the home upgrades that offer the most bang for your buck, as we reported in “11 Home Upgrades With the Best Payback in 2020.”

If you’re unsure what type of deck to get, consider the real thing: Decks made of wood boards have a slightly higher average return on investment than those made with composite boards, according to Remodeling Magazine.

9. Fencing

Koldunova Anna / Shutterstock.com

Households that did this type of project in 2020: 16.1%

If you are dreaming of creating an outdoor living space, adding a fence is a good first project. It defines a space and can add privacy.

For more ideas for creating an outdoor oasis without taking on major renovations, check out “11 Ways to Upgrade Your Yard for $100 or Less.”

8. Roofing

Man installing asphalt shingles on a roof
Christina Richards / Shutterstock.com

Households that did this type of project in 2020: 16.3%

If you’re replacing your roof and unsure what material to use, consider asphalt shingles. An asphalt-shingle roofing replacement is among the 10 best outdoor home upgrades for your money, according to a 2020 analysis by Remodeling Magazine.

6. Smart home devices (tie)

RossHelen / Shutterstock.com

Households that did this type of project in 2020: 19.2%

Smart home improvements can be as simple as installing a remotely controlled thermostat, a video-camera doorbell or electronically controlled door locks, lightbulbs and smoke detectors, says Consumer Reports.

Several such devices — from Roomba robotic vacuums to the myQ smart garage door opener — were among the most popular purchases during Prime Day 2020.

Bigger-ticket projects include installing a smart home security system. Or, you may want to spring for a control unit that lets you manage your home temperature, lighting and security from a single point.

6. Exterior painting (tie)

NinaMalyna / Shutterstock.com

Households that did this type of project in 2020: 19.2%

If you plan to do a painting project yourself and are unsure which paint brand to go with, consider Sherwin-Williams. In J.D. Power’s 2020 Paint Satisfaction Study, consumers rated it the best brand of exterior paint and exterior stain — not to mention the best brand of interior paint, too.

5. Kitchen renovations

Carpenter kitchen remodel
Michael Dechev / Shutterstock.com

Households that did this type of project in 2020: 22.6%

A kitchen remodel is the dream of many homeowners. And with homes more the focus of our lives now, wear and tear in living spaces is increasing, the HomeAdvisor report says.

Fortunately, homeowners find that a kitchen remodel pays them back with plenty of happiness. A 2019 analysis by the National Association of Realtors found that a complete kitchen was one of only two home upgrades that earned a “Joy Score” of 10 out of 10, as we reported in “19 Home Renovations That Give Owners the Most Joy.”

4. Landscaping

juefraphoto / Shutterstock.com

Households that did this type of project in 2020: 24%

Home improvements that the HomeAdvisor report classifies as maintenance projects includes general maintenance projects, cleaning projects and landscaping projects. Of these, landscaping was most common during the pandemic, with homeowners completing 3.4 such projects, on average.

3. Flooring

Halfpoint / Shutterstock.com

Households that did this type of project in 2020: 25.8%

Installing a new floor was one of the most popular remodeling jobs during the pandemic, according to HomeAdvisor.

It’s also a popular home improvement project in general. A 2019 analysis out of Harvard University’s Joint Center for Housing Studies found that more than 5.2 million homeowners replaced indoor flooring in 2017, making it the No. 1 renovation.

2. Bathroom renovations

forestpath / Shutterstock.com

Households that did this type of project in 2020: 30.9%

While bathroom renovations are among the most sought-after home improvements amid the coronavirus pandemic, they are among the worst for your money.

Midrange, upscale and universal-design bathroom remodels all ranked poorly in Remodeling Magazine’s 2020 Cost vs. Value Report.

1. Interior painting

woman painting her home
stockfour / Shutterstock.com

Households that did this type of project in 2020: 34.5%

When home was just a pit stop in a busy life spent elsewhere, you may have not have paid attention to the plaid wallpaper that was there when you moved in. Now, it shouts, “Replace me! Paint me!”

The HomeAdvisor report concludes:

“More time spent at home, also means more time noticing problems in the home.”

If this type of project is in your future, be sure to first check out “Paint Your Home Like a Pro With These 12 Tips.”

Disclosure: The information you read here is always objective. However, we sometimes receive compensation when you click links within our stories.

10 U.S. Counties at Highest Risk From Natural Disasters

Woman sits outside her destroyed houseWoman sits outside her destroyed house
Vlad Teodor / Shutterstock.com

The old cliche about real estate — “location, location, location” — cuts both ways.

Living in the right place brings plenty of upside. But even some of the nicest locations can hide a downside. If you live in one of a handful of U.S. counties, you might be at an especially high risk of experiencing natural hazards.

Recently, the Federal Emergency Management Agency (FEMA) unveiled its new National Risk Index. The online resource details which communities are most vulnerable to natural hazards.

In determining which places confront the most danger, FEMA analyzed risk factors from 18 natural hazards, from droughts to flooding. According to FEMA:

“The interactive mapping tool can help communities, especially those with limited flood mapping and risk assessment capabilities, better prepare for natural hazards by providing standardized risk data for mitigation planning and an overview of multiple risk factors.”

The index determines risk by a community’s expected:

  • Annual loss, based on hazard frequency, exposure and historic loss rate
  • Social vulnerability, which gauges the susceptibility of impacted social groups
  • Community resilience, which measures the ability of a community to recover from the impacts of natural hazards

Given that criteria, FEMA has designated the following U.S. counties at “very high” risk of natural hazards.

10. Queens County, New York

Flushing Meadows ParkFlushing Meadows Park
evantravels / Shutterstock.com

Overall risk index score: 49.97 out of 100

Risk index scores for specific natural hazards that are considered “very high”:

  • Coastal flooding: 83.44 out of 100
  • Strong wind: 78.24
  • Ice storm: 72.76
  • Heat wave: 44.52

9. Dallas County, Texas

Joseph Sohm / Shutterstock.com

Overall risk index score: 52.45 out of 100

Risk index scores for specific natural hazards that are considered “very high”:

  • Hail: 100 out of 100
  • Riverine flooding: 49.20
  • Lightning: 48.55

8. San Bernardino County, California

The Pacific Crest Trail near Silverwood Lake in San Bernardino County, CaliforniaThe Pacific Crest Trail near Silverwood Lake in San Bernardino County, California
Gestalt Imagery / Shutterstock.com

Overall risk index score: 52.56 out of 100

Risk index scores for specific natural hazards that are considered “very high”:

  • Wildfire: 74.86 out of 100
  • Riverine flooding: 47.93

7. Riverside County, California

Peace BridgePeace Bridge
Jon Bilous / Shutterstock.com

Overall risk index score: 55.8 out of 100

Risk index scores for specific natural hazards that are considered “very high”:

  • Wildfire: 100 out of 100
  • Drought: 54.93
  • Riverine flooding: 41.79

6. Kings County, New York

Kamira / Shutterstock.com

Overall risk index score: 56.52 out of 100

Risk index scores for specific natural hazards that are considered “very high”:

  • Ice storm: 87.77 out of 100
  • Coastal flooding: 83.38
  • Strong wind: 81.31
  • Heat wave: 65.63
  • Lightning: 59.49

5. Philadelphia County, Pennsylvania

Love Park statue in PhiladelphiaLove Park statue in Philadelphia
f11photo / Shutterstock.com

Overall risk index score: 57.72 out of 100

Risk index scores for specific natural hazards that are considered “very high”:

  • Heat wave: 100 out of 100
  • Winter weather: 85.32
  • Lightning: 77.21
  • Ice storm: 59.45
  • Tornado: 56.35
  • Riverine flooding: 46.34
  • Strong wind: 43.44

4. Miami-Dade County, Florida

Miami beachMiami beach
goodluz / Shutterstock.com

Overall risk index score: 58.25 out of 100

Risk index scores for specific natural hazards that are considered “very high”:

  • Hurricane: 100 out of 100
  • Lightning: 100
  • Riverine flooding: 100
  • Cold wave: 99.77

3. New York County, New York

New York CityNew York City
Songquan Deng / Shutterstock.com

Overall risk index score: 69.91 out of 100

Risk index scores for specific natural hazards that are considered “very high”:

  • Tornado: 84.47 out of 100
  • Strong wind: 60.86
  • Ice storm: 59.31
  • Winter weather: 59.01
  • Heat wave: 54.44

2. Bronx County, New York

Bronx ZooBronx Zoo
Stuart Monk / Shutterstock.com

Overall risk index score: 85.63 out of 100

Risk index scores for specific natural hazards that are considered “very high”:

  • Ice storm: 100 out of 100
  • Strong wind: 100
  • Tornado: 100
  • Winter weather: 100
  • Coastal flooding: 75.34
  • Heat wave: 68.36
  • Landslide: 57.33

1. Los Angeles County, California

The streets of Los Angeles, where median rent is relatively lowThe streets of Los Angeles, where median rent is relatively low
Sean Pavone / Shutterstock.com

Overall risk index score: 100 out of 100

Risk index scores for specific natural hazards that are considered “very high”:

  • Earthquake: 100 out of 100
  • Wildfire: 89.60
  • Riverine flooding: 46.87

Disclosure: The information you read here is always objective. However, we sometimes receive compensation when you click links within our stories.

10 Things Frugal People Never Buy

Winking woman with moneyWinking woman with money
Alliance Images / Shutterstock.com

Those of us who are frugal know deep in our bones that there are things we would never, ever pay for.

Ever.

If you have the tightwad gene, you can probably feel your skin crawl at the mere thought of plunking down hard-earned cash on certain items. Following are some items sensible spenders avoid buying at all costs.

1. Books

Young man with stack of books.Young man with stack of books.
Aaron Amat / Shutterstock.com

Some people — even frugal folks — love new books. The romance of cracking open a new book and smelling the pages sends them into bibliophilic ecstasy.

But this is where you can separate merely cautious spenders from the true hardcore tightwads. The latter will only buy a book as a last resort. The library is king for truly frugal readers. We’ll even resort to interlibrary loans if we must.

For more about the great values that you can find at our favorite “home away from home,” check out “Don’t Pay for These 10 Things: They Are Free With a Library Card.”

2. Bottled water

Woman drinking bottled waterWoman drinking bottled water
sirtravelalot / Shutterstock.com

Bottled water is the scourge of cheapskates everywhere. Why on earth would anyone pay for something that is available for nearly free? You might as well charge us for the air we breathe.

Of course, there are times when you need your H2O to go. But a small investment in a good reusable water bottle more than pays off over the years.

3. The latest technology

People waiting in line for an iPhonePeople waiting in line for an iPhone
nyker / Shutterstock.com

Frugal people never buy the latest and greatest of anything. Catch a supposedly careful shopper in one of those long lines to purchase the newest iPhone, and you can officially revoke his or her “cheapskate license.”

Patience is a hallmark of the frugal life. Wait to purchase that iPhone until the price comes way down, and you’ll enjoy it as much as those cutting-edge folks — just a little later, and at a big savings.

4. Lottery tickets

Surprised lottery winner holding cashSurprised lottery winner holding cash
Wpadington / Shutterstock.com

Get real: No one with an ounce of frugality coursing through their veins is ever going to buy a ticket to the greatest scam this side of a Vegas casino.

We reported that the odds of winning one recent Mega Millions lottery drawing were in 1 in 303 million. How bad is that? Well, you have much better odds of:

  • Being struck by lightning
  • Dying in a shark attack
  • Becoming a millionaire

Have the jones to gamble? Invest money in stocks. Your odds of success are infinitely better. For more, check out “7 Keys to Stress-Free Retirement Investing.”

5. A brand-new car

AboutLife / Shutterstock.com

In some ways, this is the ultimate sin in the eyes of economically minded folks. You could skip buying every other wasteful thing on this list, yet still blow your budget to smithereens simply by succumbing to the lure of a shiny new set of wheels.

Our mantra at Money Talks News is to never buy a brand-new car. We’re afraid to even look at them. Instead, we avoid the siren song of the latest models by plugging our ears and heading straight for the “gently used” area of the dealer lot.

For more tips on getting a good deal on a car, even during a pandemic, read “This Is the Cheapest Place to Buy a Used Car.”

6. $5 coffee

Woman sipping coffeeWoman sipping coffee
ARENA Creative / Shutterstock.com

Ah, the latte factor. Countless financial experts insist you can slowly get rich simply by skipping that expensive daily trip to the coffee shop.

This tip is lost on true frugalistas, however, because the very notion of darkening the door of our local Starbucks is a nonstarter anyway. We’ll make our coffee at home, thanks — and save a bundle.

7. Cable TV

Unhappy woman watching TVUnhappy woman watching TV
Nicoleta Ionescu / Shutterstock.com

This is another item that separates the truly frugal souls from the wannabes. A 2020 analysis by DecisionData.org found that the average household cable package costs $217.42 per month.

If you’re a cheapskate, we’ll wait a minute while you pick yourself up off the floor.

Fortunately, you have plenty of options for cheaper — even free — entertainment. Budget-friendly streaming alternatives to cable include:

  • Sling TV: Offers two plans — Sling Orange and Sling Blue — each priced at $35 monthly.
  • Philo: Offers more than 60 channels for $20 a month.
  • Hulu: Offers access to thousands of shows and movies beginning at $5.99 a month.

Or, if you can be happy with a more restrictive library of movies and shows, consider “15 Free Streaming Services to Watch While Stuck at Home.”

8. Brand names when generics are available

Generic and brand-name itemsGeneric and brand-name items
Sheila Fitzgerald / Shutterstock.com

You walk into the grocery store and see two 16-ounce boxes of spaghetti. The Barilla costs $1.25 and the store brand costs 88 cents. You grab the Barilla and toss it into your cart.

Why? For the love of all that is good and holy, why?

Thrifty shoppers will almost always choose the generic over any brand name, unless the latter is on sale. Some might even be accused of occasionally sacrificing a bit of quality simply to save a buck. (And they’d be right.)

In many cases, a generic is almost indistinguishable from the brand-name product, and most of the time it is less expensive. So, find a spot in your heart for those store brands. To get started, check out “32 Products You Should Always Buy Generic.”

9. Dry-clean-only clothes

Dry cleaner workerDry cleaner worker
sirtravelalot / Shutterstock.com

They say clothes make the person, but they can also destroy the wallet.

Clothes that must be dry-cleaned not only require you to pay for the service, but also to waste gas — and that most precious of commodities, time — getting your clothes serviced.

Dry cleaning uses chemical solvents — instead of soap and water — to clean your clothes. Some people say you can hand-wash those clothes at home instead. We say you should stick to machine-washable garments.

10. Fancy vacations

Syda Productions / Shutterstock.com

We get it: It’s been a long, ugly year. As soon as the pandemic is history, you plan to book a trip to that lovely five-star resort in Barbados.

And that’s fine. It’s just not the sort of thing frugal people do.

Every dollar you save now gets you a little bit closer to financial independence. When you are just starting the process of saving, a $5,000 vacation can be a wealth-buster. Later on, when you have money to burn, spending several thousand dollars to pamper yourself will hardly put a dent in your overall budget.

Spend now and regret it later, or save now and enjoy it later. The choice is yours. Happy saving!

Disclosure: The information you read here is always objective. However, we sometimes receive compensation when you click links within our stories.

The 15 Best-Paying Cities for Real Estate Agents

Real estate agent
ESB Professional / Shutterstock.com

This story originally appeared on Inspection Support Network.

Even before the COVID-19 pandemic, real estate agents were adopting new technologies as a way to connect with young, tech-savvy homebuyers. However, like so many other economic sectors, the real estate industry has been forced to expand these practices in response to social-distancing measures taken to reduce exposure to the coronavirus.

Now, virtual open houses and watch parties are the norm, and even formerly non-tech-savvy agents are embracing online document software and drone photography to comply with new restrictions.

Even with recent economic disruptions and high levels of unemployment, the real estate industry remains strong. And data from the S&P/Case-Shiller U.S. National Home Price Index reveals that home prices — fueled by strong demand and a limited supply — continue to rise.

To identify the best-paying metropolitan areas for real estate agents, researchers at Inspection Support Network (ISN) analyzed data from the U.S. Bureau of Labor Statistics and U.S. Bureau of Economic Analysis to calculate cost-of-living-adjusted median annual wages. In expensive metros, wages for real estate agents were adjusted down to reflect less purchasing power; whereas, in more affordable locations, wages were adjusted up to reflect greater purchasing power.

ISN also calculated the relative concentration of real estate agents in each location compared with the U.S. average.

The highest-paying cities for real estate agents are dispersed throughout the country and represent a diverse set of cities. Real estate agents looking for high pay can choose between a number of metros in every region of the country.

However, one important caveat is that this analysis draws from data collected prior to the pandemic, and the subsequent changes to the real estate market could have lasting effects on where future buyers are searching for homes.

Following are metros with the highest cost-of-living-adjusted wages for real estate agents.

15. San Diego-Carlsbad, CA

The skyline of San Diego, where median rent is well below median mortgage payments
Dancestrokes / Shutterstock.com
  • Median wage for real estate agents (adjusted): $57,723
  • Median wage for real estate agents (unadjusted): $67,190
  • Median wage for all workers (unadjusted): $45,050
  • Cost of living (compared with U.S. average): +16.4%
  • Concentration of real estate agents (compared with U.S. average): -53.0%

14. San Jose-Sunnyvale-Santa Clara, CA

San Jose California
Uladzik Kryhin / Shutterstock.com
  • Median wage for real estate agents (adjusted): $58,462
  • Median wage for real estate agents (unadjusted): $75,650
  • Median wage for all workers (unadjusted): $61,980
  • Cost of living (compared with U.S. average): +29.4%
  • Concentration of real estate agents (compared with U.S. average): -55.0%

13. Detroit-Warren-Dearborn, MI

Aerial view of downtown Detroit
Andrey Bayda / Shutterstock.com
  • Median wage for real estate agents (adjusted): $58,565
  • Median wage for real estate agents (unadjusted): $55,930
  • Median wage for all workers (unadjusted): $41,620
  • Cost of living (compared with U.S. average): -4.5%
  • Concentration of real estate agents (compared with U.S. average): -46.0%

12. Boston-Cambridge-Nashua, MA-NH

Boston, Massachusetts
Roman Babakin / Shutterstock.com
  • Median wage for real estate agents (adjusted): $59,387
  • Median wage for real estate agents (unadjusted): $67,820
  • Median wage for all workers (unadjusted): $53,300
  • Cost of living (compared with U.S. average): +14.2%
  • Concentration of real estate agents (compared with U.S. average): -46.0%

11. Birmingham-Hoover, AL

Birmingham, Alabama
Sean Pavone / Shutterstock.com
  • Median wage for real estate agents (adjusted): $59,628
  • Median wage for real estate agents (unadjusted): $52,890
  • Median wage for all workers (unadjusted): $38,020
  • Cost of living (compared with U.S. average): -11.3%
  • Concentration of real estate agents (compared with U.S. average): +38.0%

10. Memphis, TN-MS-AR

Memphis, Tennessee
Steven Frame / Shutterstock.com
  • Median wage for real estate agents (adjusted): $60,543
  • Median wage for real estate agents (unadjusted): $54,610
  • Median wage for all workers (unadjusted): $35,540
  • Cost of living (compared with U.S. average): -9.8%
  • Concentration of real estate agents (compared with U.S. average): -29.0%

9. Sacramento–Roseville–Arden-Arcade, CA

Sacramento, California
Ed Gavryush / Shutterstock.com
  • Median wage for real estate agents (adjusted): $61,245
  • Median wage for real estate agents (unadjusted): $63,450
  • Median wage for all workers (unadjusted): $44,590
  • Cost of living (compared with U.S. average): +3.6%
  • Concentration of real estate agents (compared with U.S. average): -51.0%

8. Austin-Round Rock, TX

Traffic in Austin, Texas
Philip Lange / Shutterstock.com
  • Median wage for real estate agents (adjusted): $61,747
  • Median wage for real estate agents (unadjusted): $61,870
  • Median wage for all workers (unadjusted): $41,560
  • Cost of living (compared with U.S. average): +0.2%
  • Concentration of real estate agents (compared with U.S. average): +60.0%

7. New York-Newark-Jersey City, NY-NJ-PA

New York City coastline
IM_photo / Shutterstock.com
  • Median wage for real estate agents (adjusted): $65,802
  • Median wage for real estate agents (unadjusted): $81,660
  • Median wage for all workers (unadjusted): $48,840
  • Cost of living (compared with U.S. average): +24.1%
  • Concentration of real estate agents (compared with U.S. average): -47.0%

6. Houston-The Woodlands-Sugar Land, TX

Houston, Texas
Sean Pavone / Shutterstock.com
  • Median wage for real estate agents (adjusted): $67,348
  • Median wage for real estate agents (unadjusted): $68,560
  • Median wage for all workers (unadjusted): $40,570
  • Cost of living (compared with U.S. average): +1.8%
  • Concentration of real estate agents (compared with U.S. average): +47.0%

5. Pittsburgh, PA

Pittsburgh, Pennsylvania
Sean Pavone / Shutterstock.com
  • Median wage for real estate agents (adjusted): $68,120
  • Median wage for real estate agents (unadjusted): $63,420
  • Median wage for all workers (unadjusted): $40,570
  • Cost of living (compared with U.S. average): -6.9%
  • Concentration of real estate agents (compared with U.S. average): +31.0%

4. Las Vegas-Henderson-Paradise, NV

Las Vegas neighborhood with desert hills beyond.
Christopher Boswell / Shutterstock.com
  • Median wage for real estate agents (adjusted): $70,671
  • Median wage for real estate agents (unadjusted): $68,410
  • Median wage for all workers (unadjusted): $35,660
  • Cost of living (compared with U.S. average): -3.2%
  • Concentration of real estate agents (compared with U.S. average): +63.0%

3. Dallas-Fort Worth-Arlington, TX

Dallas, Texas
Sean Pavone / Shutterstock.com
  • Median wage for real estate agents (adjusted): $70,884
  • Median wage for real estate agents (unadjusted): $71,380
  • Median wage for all workers (unadjusted): $40,430
  • Cost of living (compared with U.S. average): +0.7%
  • Concentration of real estate agents (compared with U.S. average): +29.0%

2. Denver-Aurora-Lakewood, CO

Denver Colorado
Kevin Ruck / Shutterstock.com
  • Median wage for real estate agents (adjusted): $74,404
  • Median wage for real estate agents (unadjusted): $78,050
  • Median wage for all workers (unadjusted): $47,440
  • Cost of living (compared with U.S. average): +4.9%
  • Concentration of real estate agents (compared with U.S. average): +41.0%

1. Rochester, NY

Rochester, New York
Sirichai netthong / Shutterstock.com
  • Median wage for real estate agents (adjusted): $74,821
  • Median wage for real estate agents (unadjusted): $73,100
  • Median wage for all workers (unadjusted): $40,070
  • Cost of living (compared with U.S. average): -2.3%
  • Concentration of real estate agents (compared with U.S. average): -73.0%

Methodology & Detailed Findings

Man analyzing data on a laptop
fizkes / Shutterstock.com

The wage and employment data used in this analysis is from the U.S. Bureau of Labor Statistics 2019 Occupational Employment Survey, which covers wage and salary workers in non-farm establishments. The cost-of-living data is from the U.S. Bureau of Economic Analysis Regional Price Parities.

To identify the best-paying locations for real estate agents, cost-of-living-adjusted median annual wages were calculated. In expensive locations, wages were adjusted down to reflect lower purchasing power; whereas, in more affordable locations, wages were adjusted up to reflect more purchasing power.

Researchers also included the relative concentration of real estate agents in each location compared with the U.S. average. This statistic is the percentage difference between the concentration of real estate agents in the given location and the concentration of real estate agents in the U.S. as a whole.

Only metropolitan areas with at least 100,000 residents and available data from the BLS were included in the analysis.

Disclosure: The information you read here is always objective. However, we sometimes receive compensation when you click links within our stories.

10 Cities With the Best Work-Life Balance for 2021

man relaxing work life balance
Andreas Saldavs / Shutterstock.com

This story originally appeared on SmartAsset.com.

For most people, working is inevitable: You need a job to afford your lifestyle. The trick, of course, is to find a balance where you can earn the money you need without spending all of your time in the workplace. Some of that depends on what the work culture is like in your city, how much you need to earn to pay for housing, and how long you have to spend getting to work. To that end, SmartAsset analyzed 100 of the biggest cities in the country to find the best cities for work-life balance for 2021.

To do so, we considered data on the following metrics: walk score; arts, entertainment and recreation establishments as a percentage of all establishments; restaurants as a percentage of all establishments; housing costs as a percentage of income; average weeks worked per year; average hours worked per week; average commute time; percentage of workers with a commute longer than 60 minutes; and October 2020 unemployment rate and labor force participation rate. For details on our data sources and how we put all the information together to create our final rankings, check out the Data and Methodology section at the end.

This is SmartAsset’s fourth study on the cities with the best work-life balance. Read the 2020 version here.

1. Madison, WI

Madison, Wisconsin
MarynaG / Shutterstock.com

For the second year in a row, Madison, Wisconsin, is the best city in America for work-life balance. Madison doesn’t lead in any categories, but it does finish in the top 10% of the study for six of the 10 metrics. This includes coming in second-lowest for average hours worked per week (36.4), third-lowest for October 2020 unemployment rate (3.9%), and sixth-highest for labor force participation rate (73.2%).

2. Virginia Beach, VA

Ritu Manoj Jethani / Shutterstock.com

Virginia Beach, Virginia, ranks in the top 10% of this study for two metrics: fourth-highest for restaurants as a percentage of all establishments (10.10%) and sixth-lowest for October 2020 unemployment rate (4.7%). The beach town also ranks in the top 20% of the study for two other metrics: 14th-best for labor force participation rate (71.9%) and 17th-best for arts, entertainment, and recreation establishments as a percentage of all establishments (1.88%).

3. Minneapolis, MN

Lake Calhoun, Minneapolis
Roger Siljander / Shutterstock.com

Minneapolis is the first Minnesota city to make this list, and it does so on the back of finishing in the top five for two different metrics: third for a strong labor force participation rate (74.9%) and fifth for a low October 2020 unemployment rate (4.5%). Minneapolis also places 12th-best in terms of housing costs as a percentage of income at 29.43%.

4. Lincoln, NE

Lincoln, Nebraska
Mark Dahmke / Shutterstock.com

Lincoln, Nebraska, has the lowest October 2020 unemployment rate in the study, at just 2.7%. Lincoln also finishes second for the best commute time, an average of just 18.4 minutes, and places sixth-lowest for the percentage of commuters with a commute of longer than 60 minutes, just 2.7%. Lincoln finishes near the bottom of the study, though, in terms of the average weeks worked per year, at 39.65.

5. Omaha, NE

Omaha, Nebraska
EQRoy / Shutterstock.com

Another Nebraska city is next — the state’s largest metro, Omaha. The unemployment rate there in October 2020 was 3.3%, the second-lowest in the study — giving the top two spots in that metric to Nebraska cities. Omaha also places eighth-best in terms of average commute time. The average commuter in Omaha spends just 20.1 minutes in transit, a far cry from the traffic-packed streets of some bigger cities. Omaha residents do work much of the year, finishing in the bottom quartile with 38.47 weeks worked per year.

6. Arlington, VA

Arlington, Virginia
Sean Pavone / Shutterstock.com

Arlington, Virginia, is a suburb of Washington, D.C., and it has the highest labor force participation rate in this study, 78.0%. Arlington also ranks second-lowest in the study for housing costs as a percentage of income — housing costs make up just 26.14% of income on average. People do work a lot in the town, though. Arlington ranks dead last in both the metrics measuring how much people work — an average of 41.3 hours per week and 41.80 weeks per year.

7. St. Paul, MN

St Paul Minnesota
Henryk Sadura / Shutterstock.com

St. Paul, Minnesota, joins its “Twin Cities” neighbor, Minneapolis, on this list and ranks in the top 10% of this study for three different metrics:

  • Fourth for average hours worked per week (36.8)
  • Sixth for October 2020 unemployment rate (4.7%)
  • 10th for arts, entertainment, and recreation establishments as a percentage of all establishments (2.04%)

8. Columbus, OH

Columbus, Ohio
Randall Vermillion / Shutterstock.com

Columbus, Ohio, comes in sixth for housing costs as a percentage of income, at 27.53%. That is the only metric for which Columbus places in the top 10, but it does finish 11th-best for labor force participation rate (72.4%) and 20th-best for October 2020 unemployment rate (5.4%). Columbus finishes in the bottom quartile of this study for the metric measuring how many weeks per year people work on average, at 38.16.

9. Durham, NC

Sean Pavone / Shutterstock.com

In Durham, North Carolina, just 2.7% of workers have a commute of at least an hour, the sixth-lowest total for this metric in the study. The average commute in Durham is 22.6 minutes, the 25th-lowest time spent traveling to work that we observed overall. Durham is not a particularly walkable city, however, finishing in the bottom 10% of the study in terms of walk score.

10. Lexington-Fayette, KY

Lexington, Kentucky
Henryk Sadura / Shutterstock.com

Lexington-Fayette is the final entry in our top 10, and it finishes in the top 15% for three metrics:

  • 14th for arts, entertainment, and recreation establishments as a percentage of all establishments (1.95%)
  • 14th for average commute time (21 minutes)
  • 15th for housing costs as a percentage of income (29.66%)

Lexington suffers when it comes to walkability, though, finishing in the bottom quartile of the study in terms of walk score.

Data and Methodology

A young woman reading carefully on her laptop
Rawpixel.com / Shutterstock.com

To find the best cities for work-life balance, we compared 100 of the largest cities in America across the following metrics:

  • Walk score. Data comes from walkscore.com and is for 2020.
  • Concentration of arts, entertainment, and recreation establishments. This is the number of arts, entertainment, and recreation establishments as a percentage of all establishments. Data comes from the Census Bureau’s 2018 County Business Patterns Survey.
  • Concentration of restaurants. This is the number of restaurants as a percentage of all establishments. Data comes from the Census Bureau’s 2018 County Business Patterns Survey.
  • Housing costs as a percentage of income. This is the median housing cost as a percentage of income for full-time workers. Data comes from the Census Bureau’s 2019 1-year American Community Survey.
  • Average number of weeks worked per year. This is how many weeks per year local employees work. Data comes from the Census Bureau’s 2019 1-year American Community Survey.
  • Average number of hours worked per week. This is the average number of hours a worker works in a week. Data comes from the Census Bureau’s 2019 1-year American Community Survey.
  • Average commute time. This is the average number of minutes it takes for a worker to commute to work. Data comes from the Census Bureau’s 2019 1-year American Community Survey.
  • Percentage of workers with a commute longer than 60 minutes. Data comes from the Census Bureau’s 2019 1-year American Community Survey.
  • Unemployment rate. Data comes from the Bureau of Labor Statistics and is for October 2020.
  • Labor force participation rate. Data comes from the Census Bureau’s 2019 1-year American Community Survey.

First, we ranked each city in each metric. We then found the average ranking for each city. Walk score, concentration of arts and entertainment establishments, concentration of restaurants, housing costs as a percentage of income, and labor force participation rate received a full weight. Weeks worked per year, hours worked per week, average commute time, and percentage of workers with a commute of more than an hour each received a half weight. Unemployment rate received a double weight. We then ranked the cities based on this average. The top city received an index score of 100 and the bottom city received an index score of 0.

Disclosure: The information you read here is always objective. However, we sometimes receive compensation when you click links within our stories.