The 15 Best-Paying Cities for Real Estate Agents

Real estate agent
ESB Professional / Shutterstock.com

This story originally appeared on Inspection Support Network.

Even before the COVID-19 pandemic, real estate agents were adopting new technologies as a way to connect with young, tech-savvy homebuyers. However, like so many other economic sectors, the real estate industry has been forced to expand these practices in response to social-distancing measures taken to reduce exposure to the coronavirus.

Now, virtual open houses and watch parties are the norm, and even formerly non-tech-savvy agents are embracing online document software and drone photography to comply with new restrictions.

Even with recent economic disruptions and high levels of unemployment, the real estate industry remains strong. And data from the S&P/Case-Shiller U.S. National Home Price Index reveals that home prices — fueled by strong demand and a limited supply — continue to rise.

To identify the best-paying metropolitan areas for real estate agents, researchers at Inspection Support Network (ISN) analyzed data from the U.S. Bureau of Labor Statistics and U.S. Bureau of Economic Analysis to calculate cost-of-living-adjusted median annual wages. In expensive metros, wages for real estate agents were adjusted down to reflect less purchasing power; whereas, in more affordable locations, wages were adjusted up to reflect greater purchasing power.

ISN also calculated the relative concentration of real estate agents in each location compared with the U.S. average.

The highest-paying cities for real estate agents are dispersed throughout the country and represent a diverse set of cities. Real estate agents looking for high pay can choose between a number of metros in every region of the country.

However, one important caveat is that this analysis draws from data collected prior to the pandemic, and the subsequent changes to the real estate market could have lasting effects on where future buyers are searching for homes.

Following are metros with the highest cost-of-living-adjusted wages for real estate agents.

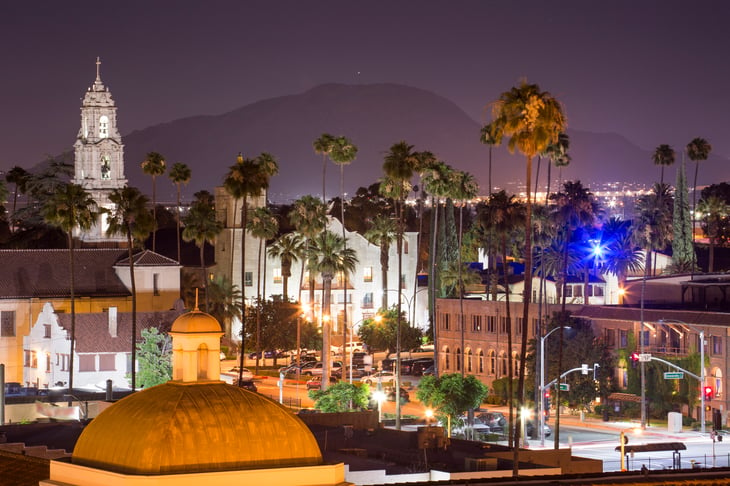
15. San Diego-Carlsbad, CA

The skyline of San Diego, where median rent is well below median mortgage payments
Dancestrokes / Shutterstock.com
  • Median wage for real estate agents (adjusted): $57,723
  • Median wage for real estate agents (unadjusted): $67,190
  • Median wage for all workers (unadjusted): $45,050
  • Cost of living (compared with U.S. average): +16.4%
  • Concentration of real estate agents (compared with U.S. average): -53.0%

14. San Jose-Sunnyvale-Santa Clara, CA

San Jose California
Uladzik Kryhin / Shutterstock.com
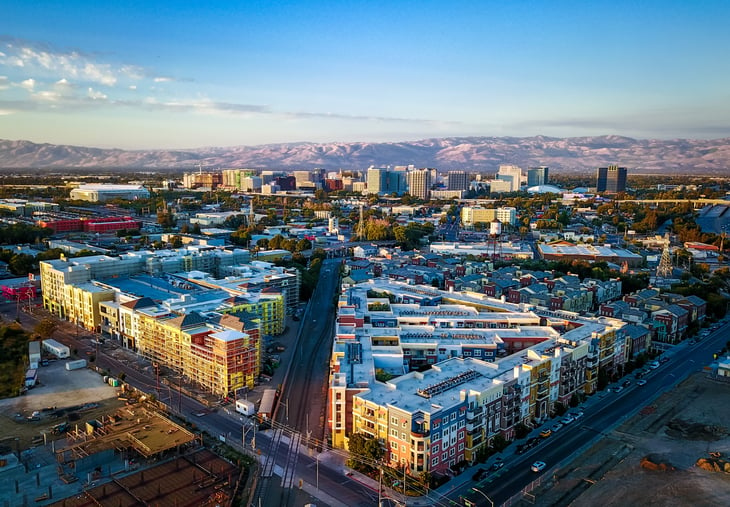
  • Median wage for real estate agents (adjusted): $58,462
  • Median wage for real estate agents (unadjusted): $75,650
  • Median wage for all workers (unadjusted): $61,980
  • Cost of living (compared with U.S. average): +29.4%
  • Concentration of real estate agents (compared with U.S. average): -55.0%

13. Detroit-Warren-Dearborn, MI

Aerial view of downtown Detroit
Andrey Bayda / Shutterstock.com
  • Median wage for real estate agents (adjusted): $58,565
  • Median wage for real estate agents (unadjusted): $55,930
  • Median wage for all workers (unadjusted): $41,620
  • Cost of living (compared with U.S. average): -4.5%
  • Concentration of real estate agents (compared with U.S. average): -46.0%

12. Boston-Cambridge-Nashua, MA-NH

Boston, Massachusetts
Roman Babakin / Shutterstock.com
  • Median wage for real estate agents (adjusted): $59,387
  • Median wage for real estate agents (unadjusted): $67,820
  • Median wage for all workers (unadjusted): $53,300
  • Cost of living (compared with U.S. average): +14.2%
  • Concentration of real estate agents (compared with U.S. average): -46.0%

11. Birmingham-Hoover, AL

Birmingham, Alabama
Sean Pavone / Shutterstock.com
  • Median wage for real estate agents (adjusted): $59,628
  • Median wage for real estate agents (unadjusted): $52,890
  • Median wage for all workers (unadjusted): $38,020
  • Cost of living (compared with U.S. average): -11.3%
  • Concentration of real estate agents (compared with U.S. average): +38.0%

10. Memphis, TN-MS-AR

Memphis, Tennessee
Steven Frame / Shutterstock.com
  • Median wage for real estate agents (adjusted): $60,543
  • Median wage for real estate agents (unadjusted): $54,610
  • Median wage for all workers (unadjusted): $35,540
  • Cost of living (compared with U.S. average): -9.8%
  • Concentration of real estate agents (compared with U.S. average): -29.0%

9. Sacramento–Roseville–Arden-Arcade, CA

Sacramento, California
Ed Gavryush / Shutterstock.com
  • Median wage for real estate agents (adjusted): $61,245
  • Median wage for real estate agents (unadjusted): $63,450
  • Median wage for all workers (unadjusted): $44,590
  • Cost of living (compared with U.S. average): +3.6%
  • Concentration of real estate agents (compared with U.S. average): -51.0%

8. Austin-Round Rock, TX

Traffic in Austin, Texas
Philip Lange / Shutterstock.com
  • Median wage for real estate agents (adjusted): $61,747
  • Median wage for real estate agents (unadjusted): $61,870
  • Median wage for all workers (unadjusted): $41,560
  • Cost of living (compared with U.S. average): +0.2%
  • Concentration of real estate agents (compared with U.S. average): +60.0%

7. New York-Newark-Jersey City, NY-NJ-PA

New York City coastline
IM_photo / Shutterstock.com
  • Median wage for real estate agents (adjusted): $65,802
  • Median wage for real estate agents (unadjusted): $81,660
  • Median wage for all workers (unadjusted): $48,840
  • Cost of living (compared with U.S. average): +24.1%
  • Concentration of real estate agents (compared with U.S. average): -47.0%

6. Houston-The Woodlands-Sugar Land, TX

Houston, Texas
Sean Pavone / Shutterstock.com
  • Median wage for real estate agents (adjusted): $67,348
  • Median wage for real estate agents (unadjusted): $68,560
  • Median wage for all workers (unadjusted): $40,570
  • Cost of living (compared with U.S. average): +1.8%
  • Concentration of real estate agents (compared with U.S. average): +47.0%

5. Pittsburgh, PA

Pittsburgh, Pennsylvania
Sean Pavone / Shutterstock.com
  • Median wage for real estate agents (adjusted): $68,120
  • Median wage for real estate agents (unadjusted): $63,420
  • Median wage for all workers (unadjusted): $40,570
  • Cost of living (compared with U.S. average): -6.9%
  • Concentration of real estate agents (compared with U.S. average): +31.0%

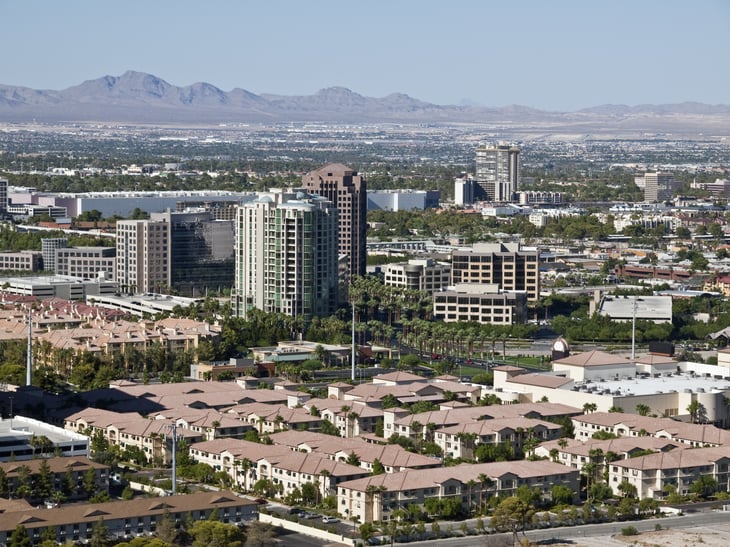
4. Las Vegas-Henderson-Paradise, NV

Las Vegas neighborhood with desert hills beyond.
Christopher Boswell / Shutterstock.com
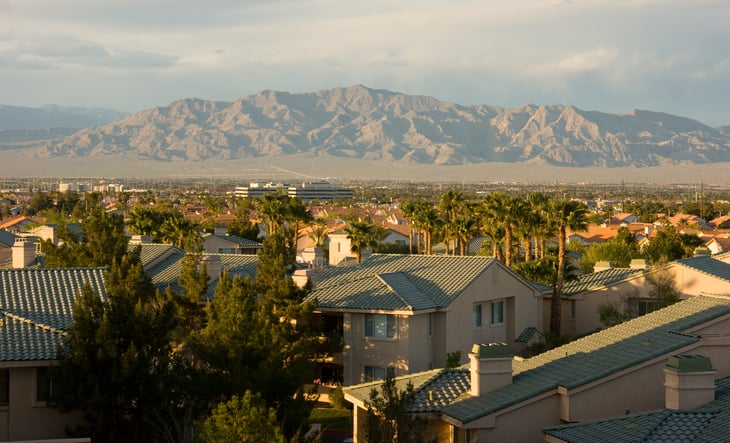
  • Median wage for real estate agents (adjusted): $70,671
  • Median wage for real estate agents (unadjusted): $68,410
  • Median wage for all workers (unadjusted): $35,660
  • Cost of living (compared with U.S. average): -3.2%
  • Concentration of real estate agents (compared with U.S. average): +63.0%

3. Dallas-Fort Worth-Arlington, TX

Dallas, Texas
Sean Pavone / Shutterstock.com
  • Median wage for real estate agents (adjusted): $70,884
  • Median wage for real estate agents (unadjusted): $71,380
  • Median wage for all workers (unadjusted): $40,430
  • Cost of living (compared with U.S. average): +0.7%
  • Concentration of real estate agents (compared with U.S. average): +29.0%

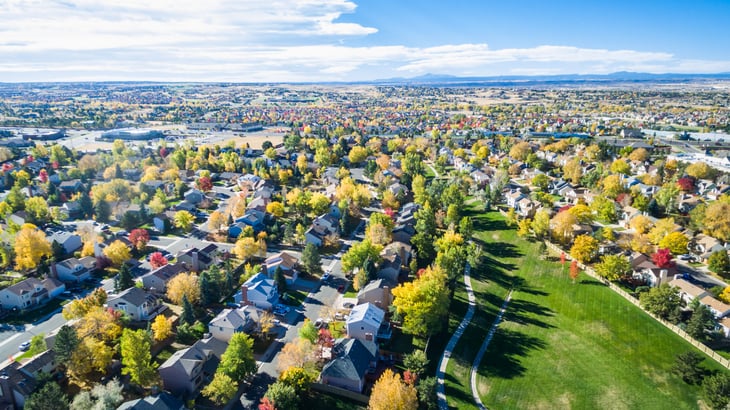
2. Denver-Aurora-Lakewood, CO

Denver Colorado
Kevin Ruck / Shutterstock.com
  • Median wage for real estate agents (adjusted): $74,404
  • Median wage for real estate agents (unadjusted): $78,050
  • Median wage for all workers (unadjusted): $47,440
  • Cost of living (compared with U.S. average): +4.9%
  • Concentration of real estate agents (compared with U.S. average): +41.0%

1. Rochester, NY

Rochester, New York
Sirichai netthong / Shutterstock.com
  • Median wage for real estate agents (adjusted): $74,821
  • Median wage for real estate agents (unadjusted): $73,100
  • Median wage for all workers (unadjusted): $40,070
  • Cost of living (compared with U.S. average): -2.3%
  • Concentration of real estate agents (compared with U.S. average): -73.0%

Methodology & Detailed Findings

Man analyzing data on a laptop
fizkes / Shutterstock.com

The wage and employment data used in this analysis is from the U.S. Bureau of Labor Statistics 2019 Occupational Employment Survey, which covers wage and salary workers in non-farm establishments. The cost-of-living data is from the U.S. Bureau of Economic Analysis Regional Price Parities.

To identify the best-paying locations for real estate agents, cost-of-living-adjusted median annual wages were calculated. In expensive locations, wages were adjusted down to reflect lower purchasing power; whereas, in more affordable locations, wages were adjusted up to reflect more purchasing power.

Researchers also included the relative concentration of real estate agents in each location compared with the U.S. average. This statistic is the percentage difference between the concentration of real estate agents in the given location and the concentration of real estate agents in the U.S. as a whole.

Only metropolitan areas with at least 100,000 residents and available data from the BLS were included in the analysis.

Disclosure: The information you read here is always objective. However, we sometimes receive compensation when you click links within our stories.

10 Cities With the Best Work-Life Balance for 2021

man relaxing work life balance
Andreas Saldavs / Shutterstock.com

This story originally appeared on SmartAsset.com.

For most people, working is inevitable: You need a job to afford your lifestyle. The trick, of course, is to find a balance where you can earn the money you need without spending all of your time in the workplace. Some of that depends on what the work culture is like in your city, how much you need to earn to pay for housing, and how long you have to spend getting to work. To that end, SmartAsset analyzed 100 of the biggest cities in the country to find the best cities for work-life balance for 2021.

To do so, we considered data on the following metrics: walk score; arts, entertainment and recreation establishments as a percentage of all establishments; restaurants as a percentage of all establishments; housing costs as a percentage of income; average weeks worked per year; average hours worked per week; average commute time; percentage of workers with a commute longer than 60 minutes; and October 2020 unemployment rate and labor force participation rate. For details on our data sources and how we put all the information together to create our final rankings, check out the Data and Methodology section at the end.

This is SmartAsset’s fourth study on the cities with the best work-life balance. Read the 2020 version here.

1. Madison, WI

Madison, Wisconsin
MarynaG / Shutterstock.com

For the second year in a row, Madison, Wisconsin, is the best city in America for work-life balance. Madison doesn’t lead in any categories, but it does finish in the top 10% of the study for six of the 10 metrics. This includes coming in second-lowest for average hours worked per week (36.4), third-lowest for October 2020 unemployment rate (3.9%), and sixth-highest for labor force participation rate (73.2%).

2. Virginia Beach, VA

Ritu Manoj Jethani / Shutterstock.com

Virginia Beach, Virginia, ranks in the top 10% of this study for two metrics: fourth-highest for restaurants as a percentage of all establishments (10.10%) and sixth-lowest for October 2020 unemployment rate (4.7%). The beach town also ranks in the top 20% of the study for two other metrics: 14th-best for labor force participation rate (71.9%) and 17th-best for arts, entertainment, and recreation establishments as a percentage of all establishments (1.88%).

3. Minneapolis, MN

Lake Calhoun, Minneapolis
Roger Siljander / Shutterstock.com

Minneapolis is the first Minnesota city to make this list, and it does so on the back of finishing in the top five for two different metrics: third for a strong labor force participation rate (74.9%) and fifth for a low October 2020 unemployment rate (4.5%). Minneapolis also places 12th-best in terms of housing costs as a percentage of income at 29.43%.

4. Lincoln, NE

Lincoln, Nebraska
Mark Dahmke / Shutterstock.com

Lincoln, Nebraska, has the lowest October 2020 unemployment rate in the study, at just 2.7%. Lincoln also finishes second for the best commute time, an average of just 18.4 minutes, and places sixth-lowest for the percentage of commuters with a commute of longer than 60 minutes, just 2.7%. Lincoln finishes near the bottom of the study, though, in terms of the average weeks worked per year, at 39.65.

5. Omaha, NE

Omaha, Nebraska
EQRoy / Shutterstock.com

Another Nebraska city is next — the state’s largest metro, Omaha. The unemployment rate there in October 2020 was 3.3%, the second-lowest in the study — giving the top two spots in that metric to Nebraska cities. Omaha also places eighth-best in terms of average commute time. The average commuter in Omaha spends just 20.1 minutes in transit, a far cry from the traffic-packed streets of some bigger cities. Omaha residents do work much of the year, finishing in the bottom quartile with 38.47 weeks worked per year.

6. Arlington, VA

Arlington, Virginia
Sean Pavone / Shutterstock.com

Arlington, Virginia, is a suburb of Washington, D.C., and it has the highest labor force participation rate in this study, 78.0%. Arlington also ranks second-lowest in the study for housing costs as a percentage of income — housing costs make up just 26.14% of income on average. People do work a lot in the town, though. Arlington ranks dead last in both the metrics measuring how much people work — an average of 41.3 hours per week and 41.80 weeks per year.

7. St. Paul, MN

St Paul Minnesota
Henryk Sadura / Shutterstock.com

St. Paul, Minnesota, joins its “Twin Cities” neighbor, Minneapolis, on this list and ranks in the top 10% of this study for three different metrics:

  • Fourth for average hours worked per week (36.8)
  • Sixth for October 2020 unemployment rate (4.7%)
  • 10th for arts, entertainment, and recreation establishments as a percentage of all establishments (2.04%)

8. Columbus, OH

Columbus, Ohio
Randall Vermillion / Shutterstock.com

Columbus, Ohio, comes in sixth for housing costs as a percentage of income, at 27.53%. That is the only metric for which Columbus places in the top 10, but it does finish 11th-best for labor force participation rate (72.4%) and 20th-best for October 2020 unemployment rate (5.4%). Columbus finishes in the bottom quartile of this study for the metric measuring how many weeks per year people work on average, at 38.16.

9. Durham, NC

Sean Pavone / Shutterstock.com

In Durham, North Carolina, just 2.7% of workers have a commute of at least an hour, the sixth-lowest total for this metric in the study. The average commute in Durham is 22.6 minutes, the 25th-lowest time spent traveling to work that we observed overall. Durham is not a particularly walkable city, however, finishing in the bottom 10% of the study in terms of walk score.

10. Lexington-Fayette, KY

Lexington, Kentucky
Henryk Sadura / Shutterstock.com

Lexington-Fayette is the final entry in our top 10, and it finishes in the top 15% for three metrics:

  • 14th for arts, entertainment, and recreation establishments as a percentage of all establishments (1.95%)
  • 14th for average commute time (21 minutes)
  • 15th for housing costs as a percentage of income (29.66%)

Lexington suffers when it comes to walkability, though, finishing in the bottom quartile of the study in terms of walk score.

Data and Methodology

A young woman reading carefully on her laptop
Rawpixel.com / Shutterstock.com

To find the best cities for work-life balance, we compared 100 of the largest cities in America across the following metrics:

  • Walk score. Data comes from walkscore.com and is for 2020.
  • Concentration of arts, entertainment, and recreation establishments. This is the number of arts, entertainment, and recreation establishments as a percentage of all establishments. Data comes from the Census Bureau’s 2018 County Business Patterns Survey.
  • Concentration of restaurants. This is the number of restaurants as a percentage of all establishments. Data comes from the Census Bureau’s 2018 County Business Patterns Survey.
  • Housing costs as a percentage of income. This is the median housing cost as a percentage of income for full-time workers. Data comes from the Census Bureau’s 2019 1-year American Community Survey.
  • Average number of weeks worked per year. This is how many weeks per year local employees work. Data comes from the Census Bureau’s 2019 1-year American Community Survey.
  • Average number of hours worked per week. This is the average number of hours a worker works in a week. Data comes from the Census Bureau’s 2019 1-year American Community Survey.
  • Average commute time. This is the average number of minutes it takes for a worker to commute to work. Data comes from the Census Bureau’s 2019 1-year American Community Survey.
  • Percentage of workers with a commute longer than 60 minutes. Data comes from the Census Bureau’s 2019 1-year American Community Survey.
  • Unemployment rate. Data comes from the Bureau of Labor Statistics and is for October 2020.
  • Labor force participation rate. Data comes from the Census Bureau’s 2019 1-year American Community Survey.

First, we ranked each city in each metric. We then found the average ranking for each city. Walk score, concentration of arts and entertainment establishments, concentration of restaurants, housing costs as a percentage of income, and labor force participation rate received a full weight. Weeks worked per year, hours worked per week, average commute time, and percentage of workers with a commute of more than an hour each received a half weight. Unemployment rate received a double weight. We then ranked the cities based on this average. The top city received an index score of 100 and the bottom city received an index score of 0.

Disclosure: The information you read here is always objective. However, we sometimes receive compensation when you click links within our stories.

7 Top Costly Mistakes Investors Made Last Year

Upset investors talking on the phone
Koldunova Anna / Shutterstock.com

Warning: Big investing mistakes can be hazardous to your wealth.

One or two basic blunders can undermine years of diligent saving and crush your dreams of building life-changing wealth.

Financial professionals see investors make such errors all the time. Recently, they identified the most common of these mistakes as part of the 2020 Natixis Global Survey of Financial Professionals.

Following are some of the costliest mistakes investors likely made in 2020 — and how to avoid them going forward.

Emotional decisions

BlueSkyImages / Shutterstock.com

When the coronavirus swept into the U.S. this spring, it sent the economy into a tailspin. The S&P 500 index plunged 34%, likely taking much of your wealth with it.

Bear markets feel like a body blow. But throughout history, new bull markets always have followed downturns. That is why hitting the panic button and selling in bad times is usually a mistake.

During this spring’s plunge, the market fell to a low on March 23. But if fearful emotions caused you to sell on that day, you missed out on one heck of a party that followed.

From March 23 through April 9, the S&P rose a stunning 25%. The 100-trading-day period after March 23 marked the best S&P performance since 1933, with a rise of more than 50%. And stocks have continued to soar ever since.

As stocks tanked earlier this year, investors in the U.S. sold $327 billion in mutual fund positions, according to Strategic Insight. The lesson? In investing, emotions can be your enemy.

Timing the market

Man timing the market
G-Stock Studio / Shutterstock.com

Let’s return to the bear market of last spring. As stocks were falling, prognosticators everywhere were rising up, telling you exactly what to do with your money.

Chances are, a few of them were right. But likely, it was very few.

Timing the market — which requires knowing exactly when to buy and precisely when to sell — is all but impossible. Numerous studies have shown that almost nobody consistently times the market well over the long haul.

In his book “Common Sense on Mutual Funds,” legendary investor John Bogle — creator of the world’s first index mutual fund — wrote:

“The idea that a bell rings to signal when investors should get into or out of the market is simply not credible. After nearly 50 years in this business, I do not know of anybody who has done it successfully and consistently. I don’t even know anybody who knows anybody who has done it successfully and consistently.”

Not recognizing risk tolerance

Walking a tightrope
Vaclav P3k / Shutterstock.com

There is no way around it: Investing is risky. Over time, the stock market rises. But there are periods — some of them long — when equities crater.

Just in the past 20 years, the S&P 500 has seen three large stock market declines, according to Investopedia:

  • Beginning in March 2000: down 49%
  • Beginning in October 2007: down 56%
  • Beginning in February 2020: down 30%

In each case, markets recovered. Sometimes, the recovery was relatively quick. The bear market of 2020 was a blip, lasting just one month.

But in other cases, recovery was a slog. The bear that growled its way onto the stage in March 2000 stayed put for 31 months.

Natixis points out that 56% of investors say they are willing to take on risk to get ahead, yet more than three-quarters say they really prefer safety over investment performance.

So, before you invest, understand exactly how much risk you are willing to take — and what you will do if things do not work out as planned.

Unrealistic expectations

Woman with money, looking stupid
Liudmila P. Sundikova / Shutterstock.com

It’s a safe bet that if you are reading this article, you hope to get rich someday. Or, at least you hope to achieve some measure of financial security.

Here’s the good news: If you save diligently and invest wisely over time, you will almost certainly increase your wealth — possibly to levels that exceed your wildest dreams.

But doing so takes time. Trying to make a quick killing in the market is likely to leave you disappointed. So is expecting wildly high returns of 20% annually.

Be patient. Keep your short-term expectations modest, and let the long term take care of itself. As we wrote in “10 Characteristics of Wildly Successful People“:

“If you aren’t willing to put in the hours and make some sacrifices, you might as well get accustomed to mediocrity. The best things in life — whether that’s money in the bank or a great relationship with your spouse or child — typically come only with significant effort.”

Taking too much risk

Bull and bear
Bacho / Shutterstock.com

As we pointed out earlier, uncertainty is part of investing. It is difficult to get rich without taking on some risk. Money Talks News founder Stacy Johnson is fond of saying you can’t get a hit from the dugout.

However, taking on too much risk can lead to disaster. It’s important to strike a balance. As Stacy says, you should never invest money you will need in the next five years, and you should not invest everything you have into the market — ever. He writes:

“One rule of thumb I’ve been advocating for decades is to subtract your age from 100, then put the difference as a percentage of your money in stocks. So if you’re 20, you can invest up to 80% in stocks. If you’re 80, 20%. If you’re nervous, invest less. It’s just a rule of thumb.”

For more, check out “7 Ways to Slay Your Fear of the Stock Market.”

Not recognizing the euphoria of an up market

Excited woman at a computer
fizkes / Shutterstock.com

When times are good, it is easy to think sunny skies will stretch on forever.

Investors who see a 10% gain in stocks over a period of six months are much more likely to expect their investments to continue to rise in the future, according to research from the Natixis Center for Investor Insight and the Massachusetts Institute of Technology.

But while it may seem counterintuitive, the more stock prices rise, the greater the danger is that a fall is on the horizon. By contrast, when stocks have plummeted — and nobody wants them — they are likely to be a safer purchase.

Those truths are at the root of one of the stock market’s oldest maxims: “Buy low, sell high.” But instead of trying to figure out when to buy and sell, simply invest for the long haul.

As legendary investor Warren Buffett says, “consistently buy an S&P 500 low-cost index fund. Keep buying it through thick and thin, and especially through thin.”

Failing to think about taxes when selling

Uncle Sam and taxes
Sean Locke Photography / Shutterstock.com

Ah, taxes: They are preferable to that other famous “inevitable” in life (death), but they still stink.

Most of us try to keep our tax obligation small. But as the folks at Natixis point out, each time you sell stock shares, you are locking yourself into paying taxes on any gains you may have accumulated. According to Natixis:

“Three-quarters of investors may say they consider tax implications when making investment decisions, but their behavior in periods of stress may actually trigger unintended taxable events. For example, a big sell-off in your portfolio could lock in gains at a time when markets are declining rapidly.”

So, Natixis encourages you to think strategically before selling. Even carefully weighing which holding you should sell first can make a big difference to how much you will owe Uncle Sam on Tax Day.

Disclosure: The information you read here is always objective. However, we sometimes receive compensation when you click links within our stories.

15 Cities With the Most Minority-Owned Startups

minority business owner
Rawpixel.com / Shutterstock.com

This story originally appeared on Self.

In addition to being a critical driver of growth in the economy overall, entrepreneurship is one of the many ways that individuals can build wealth in America. But as 2020 illustrated, opportunities to participate and succeed in the entrepreneurial economy are not equally distributed by race and ethnicity.

Last year, a wave of racial justice protests nationwide and the economic repercussions of the COVID-19 pandemic drew more attention to the struggles that minority communities face in building and sustaining wealth. According to a McKinsey analysis, two of the primary challenges facing minority business owners are structural barriers to financial health and disproportionate representation in industries most susceptible to economic shocks like those presented by COVID-19.

Despite all these challenges, today there are nearly 170,000 minority-owned startups in the U.S., employing over 700,000 people and generating close to $100 billion in annual revenue. Based on demographic trends, these numbers are likely to grow as the population continues to diversify on racial and ethnic lines. Unsurprisingly, states with higher minority populations — including “majority-minority” California and Hawaii — also lead in the percentage of startups that are minority-owned.

At the city level, the story is much the same. While areas with large minority populations also tend to have higher concentrations of minority-owned startups, minorities remain underrepresented in small-business ownership relative to their population levels. To show this trend, researchers at Self Financial used U.S. Census Bureau data to calculate the percentage of startup businesses — defined as firms less than 2 years old — that are minority-owned and the minority population share in each metro area. Researchers also included each metro’s total number of minority-owned startups, along with their number of employees and total annual sales.

Keep reading for the large metros with the most minority-owned startups.

15. Richmond, VA

Richmond, Virginia
ESB Professional / Shutterstock.com
  • Percentage of startups that are minority-owned: 19.56%
  • Number of startups that are minority-owned: 617
  • Total employees at minority-owned startups: 2,976
  • Annual sales at minority-owned startups: $260,076,000
  • Minority population share: 42.71%

14. Chicago-Naperville-Elgin, IL-IN-WI

Dream Master / Shutterstock.com
  • Percentage of startups that are minority-owned: 20.37%
  • Number of startups that are minority-owned: 5,275
  • Total employees at minority-owned startups: 19,635
  • Annual sales at minority-owned startups: $2,785,820,000
  • Minority population share: 47.10%

13. Baltimore-Columbia-Towson, MD

Baltimore, Maryland
sean-pavone / Shutterstock.com
  • Percentage of startups that are minority-owned: 22.39%
  • Number of startups that are minority-owned: 1,460
  • Total employees at minority-owned startups: 5,053
  • Annual sales at minority-owned startups: $764,077,000
  • Minority population share: 43.45%

12. Seattle-Tacoma-Bellevue, WA

Seattle
Albert Pegp / Shutterstock.com
  • Percentage of startups that are minority-owned: 22.66%
  • Number of startups that are minority-owned: 2,937
  • Total employees at minority-owned startups: 13,133
  • Annual sales at minority-owned startups: $1,576,032,000
  • Minority population share: 36.72%

11. Las Vegas-Henderson-Paradise, NV

Las Vegas homes
trekandshoot / Shutterstock.com
  • Percentage of startups that are minority-owned: 23.80%
  • Number of startups that are minority-owned: 1,624
  • Total employees at minority-owned startups: 5,946
  • Annual sales at minority-owned startups: $926,653,000
  • Minority population share: 57.23%

10. Orlando-Kissimmee-Sanford, FL

Sean Pavone / Shutterstock.com
  • Percentage of startups that are minority-owned: 23.89%
  • Number of startups that are minority-owned: 2,279
  • Total employees at minority-owned startups: 6,472
  • Annual sales at minority-owned startups: $920,034,000
  • Minority population share: 53.32%

9. Dallas-Fort Worth-Arlington, TX

Aneese / Shutterstock.com
  • Percentage of startups that are minority-owned: 24.12%
  • Number of startups that are minority-owned: 5,190
  • Total employees at minority-owned startups: 25,714
  • Annual sales at minority-owned startups: $3,382,747,000
  • Minority population share: 53.97%

8. St. Louis, MO-IL

f11photo / Shutterstock.com
  • Percentage of startups that are minority-owned: 25.03%
  • Number of startups that are minority-owned: 2,279
  • Total employees at minority-owned startups: 4,019
  • Annual sales at minority-owned startups: $193,558,000
  • Minority population share: 26.27%

7. Washington-Arlington-Alexandria, DC-VA-MD-WV

Washington, D.C.
orhan-cam / Shutterstock.com
  • Percentage of startups that are minority-owned: 29.23%
  • Number of startups that are minority-owned: 4,599
  • Total employees at minority-owned startups: 16,729
  • Annual sales at minority-owned startups: $2,480,180,000
  • Minority population share: 54.50%

6. New York-Newark-Jersey City, NY-NJ-PA

NYC New York City skyline at night
Songquan Deng / Shutterstock.com
  • Percentage of startups that are minority-owned: 29.93%
  • Number of startups that are minority-owned: 22,544
  • Total employees at minority-owned startups: 67,660
  • Annual sales at minority-owned startups: $11,803,829,000
  • Minority population share: 54.14%

5. Houston-The Woodlands-Sugar Land, TX

Houston, Texas skyline
Silvio Ligutti / Shutterstock.com
  • Percentage of startups that are minority-owned: 30.45%
  • Number of startups that are minority-owned: 5,599
  • Total employees at minority-owned startups: 22,735
  • Annual sales at minority-owned startups: $3,145,123,000
  • Minority population share: 63.85%

4. San Antonio-New Braunfels, TX

San Antonio at night.
f11 photo / Shutterstock.com
  • Percentage of startups that are minority-owned: 30.86%
  • Number of startups that are minority-owned: 1,675
  • Total employees at minority-owned startups: 8,871
  • Annual sales at minority-owned startups: $1,076,705,000
  • Minority population share: 66.32%

3. Riverside-San Bernardino-Ontario, CA

Riverside, California at night
MattGush / Shutterstock.com
  • Percentage of startups that are minority-owned: 34.07%
  • Number of startups that are minority-owned: 3,540
  • Total employees at minority-owned startups: 19,527
  • Annual sales at minority-owned startups: $2,013,083,000
  • Minority population share: 67.88%

2. Los Angeles-Long Beach-Anaheim, CA

The streets of Los Angeles, where median rent is relatively low
Sean Pavone / Shutterstock.com
  • Percentage of startups that are minority-owned: 34.70%
  • Number of startups that are minority-owned: 17,221
  • Total employees at minority-owned startups: 69,107
  • Annual sales at minority-owned startups: $11,788,812,000
  • Minority population share: 70.36%

1. San Jose-Sunnyvale-Santa Clara, CA

San Jose California
Uladzik Kryhin / Shutterstock.com
  • Percentage of startups that are minority-owned: 46.01%
  • Number of startups that are minority-owned: 2,796
  • Total employees at minority-owned startups: 11,469
  • Annual sales at minority-owned startups: $1,808,320,000
  • Minority population share: 68.38%

Detailed Findings & Methodology

a man reads his free credit report
ESB Professional / Shutterstock.com

The data used in this analysis is from the U.S. Census Bureau’s Annual Business Survey, which includes all U.S. businesses with paid employees. To identify the locations with the most minority-owned startup businesses, researchers calculated the percentage of all startup businesses (firms less than 2 years old) that are minority-owned. The researchers also calculated the minority population share of each geographic region (defined as the percentage of the total population that does not identify as non-Hispanic white) by using data from the U.S. Census Bureau’s 2019 American Community Survey.

To improve relevance, only metropolitan areas with at least 100,000 residents were included. Additionally, metros were grouped into cohorts based on population size: small (100,000–349,999), midsize (350,000–999,999), and large (1 million or more).

Disclosure: The information you read here is always objective. However, we sometimes receive compensation when you click links within our stories.

6 Things Retirees Wish They Had Done Differently

Thoughtful seniors plan for retirementThoughtful seniors plan for retirement
RossHelen / Shutterstock.com

This story originally appeared on NewRetirement.

Many retirees complete their last day of work only to find that they can’t afford to live comfortably. Looking back, they point to clear planning steps they could have taken that would have made a dramatic impact on being prepared for retirement.

Here are several ways today’s retirees say they would have planned differently, and what you can do while there is still time.

1. Save More

saving moneysaving money
Dean Drobot / Shutterstock.com

According to an annual study by the Transamerica Center for Retirement Studies, a full 78% of retirees wish they would have saved more. Retirees who were less confident about their financial situations say not saving was a major regret.

Other savings regrets included not making the most of their 401(k) plan, not enrolling in the plan early enough, and not saving the maximum amount allowed by their plan.

Too many soon-to-be retirees put off retirement saving, says Kerry Soudan with TREW Financial & Benefits Group Inc., which has offices in Chicago’s North Shore suburbs and Las Vegas. “A lot of people wait until the very end when they retire to start planning for retirement,” Soudan says.

2. Document an Overall Plan

Happy senior planning retirementHappy senior planning retirement
Monkey Business Images / Shutterstock.com

The research is clear. A written financial plan is likely to make you feel more confident about your finances (the Schwab Modern Wealth Survey showed that 63% of people with a written financial plan say they feel financially stable while only 28% of those with a plan feel the same level of comfort).

However, the Transamerica research found that only 18% of retirees have a written plan. Whether you are far from, approaching, or already in retirement, a written plan will help put your worries to rest.

And creating a written plan is easy. The NewRetirement Planner can help. Forbes Magazine calls it “a new approach to retirement planning.” It is comprehensive, reliable, and will help you discover opportunities for more wealth and security.

3. Plan More Carefully for the Fun You Want to Have in Retirement

A retired couple celebrates their freedom at the beachA retired couple celebrates their freedom at the beach
goodluz / Shutterstock.com

Two-thirds of pre-retirees (68%) have not completed a budget of anticipated income and expenses, according to Fidelity Investments.

Retirees can really underestimate how much retirement fun will cost, says Mike Niemczyk with MLN Retirement Planning Inc., with offices in Grayslake, Illinois, and McHenry County, Illinois. While many older Americans believe once they retire they’ll spend less as a result of having a lower income, financial experts say most retirees often spend more in at least the first few years of retirement.

“We find now that retirees are going out and spending more — dinner with friends, vacations,” Niemczyk says.

When helping clients budget for retirement, Soudan asks what they enjoy doing on the weekend.

“They might say, ‘Golf and then go out to dinner,’” Soudan says. “I tell them, ‘When you retire, every day is Saturday. You have to think about what it’s going to take to live like it’s Saturday seven days a week.’”

“They didn’t plan ahead of time,” Niemczyk says of the challenges many clients face. “Many are running out of money before running out of life.”

Explore the best ways to create a reliable retirement budget.

4. Plan for Health Care

Couple with financial adviserCouple with financial adviser
imtmphoto / Shutterstock.com

Not being able to afford dinner out is a surmountable problem. A bigger issue is knowing if you can afford health care.

According to a 2013 report by AARP, “only about one-third (36%) have tried to estimate how much money they will need to save and have set money aside to cover these expenses in the future. Adults age 60-64 (40%) are just slightly more likely than those age 50-59 (35%) to have money set aside although these differences are not statistically significant.”

Two-thirds of respondents have thought about the costs at least somewhat, but only 52% are confident they can afford the costs. In fact, less than 2 in 10 (16%) are very confident that they can afford the costs of health care in retirement.

Before you retire, you should get a reasonable estimate of your health care costs and make sure you can afford them. Medicare does not cover everything, and most people spend hundreds of thousands of dollars in out of pocket health care expenses in retirement — not even including funding a long-term care need.

The NewRetirement Planner can give you a personalized estimate for health care costs. It also helps you figure out how to plan for a possible long-term care need.

5. Learn More About Personal Finance

Senior couple making retirement plans with adviserSenior couple making retirement plans with adviser
Alexander Raths / Shutterstock.com

The Transamerica research suggests that a full 66% of retirees wish they were and had been more knowledgeable about financial planning.

There are a lot of considerations, ranging from investing and budgeting to debt and taxes. Good thing you are reading articles like this one!

6. Plan and Make Moves to Protect Money from Taxes

Taxes are a major consideration for retirees. Uncle Sam can take a big bite out of your nest egg.

“Many older Americans with 401(k) plans don’t realize those monies are taxed when cashed out,” Soudan says. “If you have half a million in your 401(k) you might be hit with a 30% to 40% tax,” he adds. However, with proper planning, there is a lot you can do to protect your money from taxes.

It takes forethought, but Roth conversions, taxable income shifts and other strategies can result in significant lifetime savings.

Disclosure: The information you read here is always objective. However, we sometimes receive compensation when you click links within our stories.

7 Products With Price Spikes on Amazon Amid the Pandemic

Angry woman using a laptop
ViDI Studio / Shutterstock.com

The coronavirus crisis wasn’s a plague for Amazon’s business in 2020. Founder and CEO Jeff Bezos’ wealth grew 63%, the company’s stock price rose 73%, and people are jumping on the Prime train at a record pace.

Many people are staying home to prevent getting COVID-19 and using Amazon to deliver nearly everything under the sun. But as demand for deliveries has risen, so have the prices of some products, according to a recent report by the U.S. Public Interest Research Group’s Education Fund.

The nonprofit analyzed 15 product categories, looking at the prices of 50 essential products in each category. The products examined were fulfilled by Amazon, a third-party or both.

The U.S. PIRG Education Fund discovered that, of the 750 products it analyzed, prices of 136 at least doubled and 409 increased by more than 20% over the course of 2020.

Following is a look at the seven product categories for which the U.S. PIRG Education Fund found more than half of the product listings increased in price by more than 20%.

Pulse oximeters

pulse oximeter
Click and Photo / Shutterstock.com

Pulse oximeters measure the oxygen level in a person’s blood.

The U.S. PIRG Education Fund found that 54% of listings for pulse oximeters on Amazon that it examined increased in price by more than 20% in 2020 — and 5% of those listings at least doubled in price.

Hand soaps

Woman washing her hands
Dragana Gordic / Shutterstock.com

In 2020, 59% of Amazon listings for this anti-COVID-19 essential increased in price by more than 20%, and 11% of those at least doubled in price, according to the U.S. PIRG Education Fund analysis. The nonprofit also found one instance in which a three-pack of hand soap increased in price from $25.57 to $72.94.

Perhaps not surprisingly, soap is among the pandemic must-haves that Money Talks News cites in “20 Things That Are Actually Worth Stockpiling.”

Oral thermometers

Sick woman holding thermometer
Hananeko_Studio / Shutterstock.com

The U.S. PIRG Education Fund discovered that 59% of Amazon listings for these fever-detectors that the nonprofit examined increased in price by more than 20% in 2020, and nearly one-quarter at least doubled in price. One thermometer’s price rose from $254.78 to $401.76.

If you want to go different routes in measuring your family’s temperatures, The New York Times’ Wirecutter reviews in-ear and forehead thermometers.

Patio heaters

Patio heater
Pawel Pietraszewski / Shutterstock.com

These handy products greatly enhance outdoor gatherings, and the U.S. PIRG Education Fund found that 61% of examined Amazon listings for these heaters increased in price by more than 20%, and 45% at least doubled in price in 2020.

If a patio heater isn’t your style, AARP has some ideas to stay warm outside during a time when meeting up indoors can be risky.

Cloth face masks

Woman in a mask shopping for groceries
Paulo Vilela / Shutterstock.com

In 2020, 66% of the Amazon listings for cloth face masks in the U.S. PIRG Education Fund’s analysis increased in price by at least 20%.

Increasingly more health experts are advising people to wear two masks, and Money Talks News breaks down the pros and cons of doubling up in “Does Wearing 2 Masks Protect You Better From COVID-19?

Hand sanitizers

Parent and child use hand sanitizer and face masks at school
1641857584 / Shutterstock.com

The U.S. PIRG Education Fund found that 77% of the Amazon listings for hand sanitizers that it examined increased in price by more than 20% in 2020, with nearly a quarter of those doubling in price. One hand sanitizer’s price rose from $33.13 to $178.20.

If you want to save some money and DIY your sanitizer, Money Talks News has instructions for making your own.

Disinfectant wipes

Woman using a disinfecting wipe to clean a door handle
FotoHelin / Shutterstock.com

In 2020, 78% of the Amazon listings for disinfectant wipes increased in price by at least 20%, according to the U.S. PIRG Education Fund analysis.

Despite their popularity, wipes are not the only way to kill coronavirus germs. Money Talks News details some cheaper options in “5 Cleaning Products You Should Be Using in 2021.”

Disclosure: The information you read here is always objective. However, we sometimes receive compensation when you click links within our stories.

10 Cities Expected to Attract Millennial Homebuyers in 2021

young homebuyers first houseyoung homebuyers first house
Rocketclips, Inc. / Shutterstock.com

This story originally appeared on SmartAsset.com.

The homeownership rate in America peaked at a little more than 69% in 2004 before falling to 63.7% in 2016, according to U.S. Census Bureau data. Despite the fact that it rebounded to a little more than 65% in 2019 overall, only 36.4% of Americans younger than 35 own their homes.

It may be easier in some places, though, for this younger cohort to buy homes. To that end, SmartAsset crunched the numbers to find the cities where people younger than the age of 35 are most likely to own their own home — and to see where this number has gone up in recent years.

To find the cities where more under-35 residents are buying homes, we compared the homeownership rate for this demographic in 2009 with the homeownership rate in 2019 for 200 of the largest U.S. cities. For details on our data sources and how we put all the information together to create our final rankings, check out the Data and Methodology section at the end.

1. Midland, TX

Midland, Texas skylineMidland, Texas skyline
NaturallyKristina / Shutterstock.com

Midland, Texas, has seen a 10-year increase of 17.11 percentage points in the homeownership rate among people younger than 35, the largest growth seen in this study. The total homeownership rate for that age cohort in 2019 was 52.42%, the fourth-highest rate we found for that metric. Together, this makes Midland the top place where more young residents are buying homes.

2. Cape Coral, FL

Cape Coral FloridaCape Coral Florida
mginley / Shutterstock.com

The homeownership for younger Cape Coral, Florida, residents in 2019 was 55.54%, the third-highest rate in the study for this metric. That’s an increase of 8.71 percentage points compared with 2009, and the fourth-highest increase for this metric across all 200 cities we considered.

3. Joliet, IL

Joliet IllinoisJoliet Illinois
Henryk Sadura / Shutterstock.com

Joliet, Illinois, located about 30 miles southwest of Chicago, had a homeownership rate of 63.48% for under-35 residents in 2019, the highest rate of all the cities we studied. Joliet ranks ninth for the 10-year change in homeownership, increasing 5.48 percentage points from its 2009 rate of 58.00%.

4. Mesquite, TX

Mesquite TexasMesquite Texas
mivod / Shutterstock.com

Mesquite, Texas, is part of the Dallas metro area, and in 2019 the homeownership rate there among residents younger than 35 was 45.46%, ranking it 11th in our study. But in 2009 the rate was just 35.47%, meaning the increase over 10 years was 9.99 percentage points, third-place for this metric.

5. Bakersfield, CA

Bakersfield, CaliforniaBakersfield, California
Richard Thornton / Shutterstock.com

Bakersfield, in central California, ranks 20th for homeownership rate among younger people in 2019, at 39.75%. That’s a 10.01 percentage point increase over the 10-year period from 2009 to 2019, the second-highest jump for this metric in the study.

6. Aurora, CO (tied)

Aurora ColoradoAurora Colorado
Arina P Habich / Shutterstock.com

Aurora, Colorado, ranks 15th for the 2019 homeownership rate among people younger than 35, at 42.28%. That is an increase of 5.29 percentage points from 2009, the 10th-largest jump we observed in the study.

6. Port St. Lucie, FL (tied)

Port St Lucie FloridaPort St Lucie Florida
Felix Mizioznikov / Shutterstock.com

Port St. Lucie, Florida, has the fifth-highest homeownership rate among younger people in 2019, at 51.93%. It ranks 20th for its 2.70-point increase in that percentage from 2009.

8. Gilbert, AZ

Gilbert, ArizonaGilbert, Arizona
Tim Roberts Photography / Shutterstock.com

Gilbert, Arizona, located near Phoenix, has the eighth-highest homeownership rate among residents younger than 35, at 50.08%. That was an increase of 2.69 percentage points since 2009, good enough for 21st place in that metric.

9. Fort Wayne, IN

Fort Wayne IndianaFort Wayne Indiana
Travis Eckert / Shutterstock.com

Fort Wayne, Indiana, ranked 17th in both of the metrics we measured for this study. The homeownership rate among those younger than 35 was 41.24% in 2019, a 3.32 percentage point increase over the previous 10 years.

10. Rancho Cucamonga, CA

Rancho Cucamonga CaliforniaRancho Cucamonga California
Tim Gray / Shutterstock.com

The final city in the top 10 of this study is Rancho Cucamonga, California, which ranked 21st for under-35 homeownership in 2019, at 39.39%. That is a 3.77 percentage point jump since 2009, the 14th-biggest increase we observed across all 200 cities in the study.

Data and Methodology

Happy couple buying a home in a new cityHappy couple buying a home in a new city
Monkey Business Images / Shutterstock.com

To find the cities where more young Americans are buying homes, SmartAsset examined data for 200 of the largest cities in the U.S. We considered two metrics:

  • 2019 homeownership rate for those under 35. This is the homeownership rate among 18- to 34-year-olds. Data comes from the U.S. Census Bureau’s 2019 1-year American Community Survey.
  • 10-year change in the homeownership rate for those under 35. This compares the homeownership rate among 18- to 34-year-olds in 2009 with the rate in 2019. Data comes from the U.S. Census Bureau’s 2009 and 2019 1-year American Community Surveys.

First, we ranked each city in both metrics. Then we found each city’s average ranking and used the average to determine a final score. The city with the highest average ranking received a score of 100. The city with the lowest average ranking received a score of 0.

Disclosure: The information you read here is always objective. However, we sometimes receive compensation when you click links within our stories.

7 Things I Never Buy at Costco

Woman shopping for toothbrushes
Dmitri Ma / Shutterstock.com

There are many things I always buy at Costco. But there are also things I never buy there.

Not everything the warehouse club sells is a bulk bargain.

I’m not hating on Costco, though. I’m just using the beloved retailer to underscore the potentially high cost of being loyal to a store and failing to comparison shop.

I’m talking about not just comparing the price of one brand with another sold at the same store, but comparing the prices of one retailer with those of another.

I don’t do this unit-based price research for everything I buy, but I do it for items my household uses routinely. You’d be surprised by what you learn this way.

To illustrate, I’ve examined several types of purchases that I never make at Costco. Read on to find out where I do buy these items and why.

1. Cereal

Rido / Shutterstock.com

Frosted Flakes, Rice Krispies, Shredded Wheat, Special K — whatever cereal brand your household fancies, you’ll likely find it at Costco for less than it normally costs elsewhere. But that assumes you’re above generic and house brands.

Chains like Walmart and Aldi sell their own versions of a lot of big-name cereals. I’ve done the math on several that my household eats and always found them cheaper than Costco’s options.

Aldi has even better cereal prices than Walmart, in my experience, although I’ve only ever found generic Grape Nuts at Walmart. (The retailer’s Great Value brand sells them as “Crunchy Nuggets.”)

Wondering what else you might be overlooking at Aldi? Check out “My 7 Favorite Things to Buy at Aldi.”

2. Sandwich, storage and freezer bags

oliveromg / Shutterstock.com

We use a lot of resealable clear plastic bags in my house, so it bothers me to reach for a box at the store and not know that it’s the cheapest option that’ll do the job.

I’ve done the math on several types and sizes of these bags. Walmart’s Great Value brand always wins.

As with cereal, part of the problem with buying plastic sandwich and storage bags at Costco is that my store only carries one brand, which is a brand name: Ziploc.

Ziploc sandwich bags from my Costco, for example, cost roughly 10% more than Walmart’s Great Value version the last time I compared prices. And the price difference widens for larger and fancier bags.

3. Manual toothbrushes

Casezy idea / Shutterstock.com

To be fair, not buying toothbrushes at Costco isn’t so much about price as it is about selection, and I do buy electric toothbrush heads at Costco because of their price.

I prefer manual toothbrushes that carry the American Dental Association’s Seal of Acceptance, though. I’ve not seen them at my Costco store, so I usually order them online or grab them at Walmart or Target.

4. Trash bags

Travis Wolfe / Shutterstock.com

One of my household’s trash cans requires oversized trash bags — roughly 25- to 30-gallon bags — preferably with drawstrings.

The last time I checked, the cheapest option that fit the bill at Costco (33-gallon bags by Costco’s Kirkland Signature brand) was 2.5 cents more per bag than the cheapest option at Aldi (30-gallon bags by Aldi’s Boulder brand). That translated to Aldi’s bags costing 13% less.

For a list of Kirkland Signature products that are worth considering, check out “11 Generic Products You Should Buy at Costco.”

5. Shave gel

Jacob Lund / Shutterstock.com

Shave gel, like manual toothbrushes, is something I never buy at Costco due to a combination of selection and price.

My sensitive skin prefers shave gel or cream with as little fragrance as possible. The most affordable such option I’ve found is the Therapeutic Shave Gel from Target’s Up & Up brand. It lists fragrance as its second-to-last ingredient and costs me $2.69 at most. (By federal law, cosmetics ingredients must be listed in descending order of prominence, meaning listed in an order that reflects how prevalent they are, with the ingredients that constitute the largest percentages of a product listed first.)

6. Shampoo

Iakov Filiminov / Shutterstock.com

Suave’s Daily Clarifying Shampoo is about as basic as shampoo gets, but it does the job just fine for me. Not to mention I can buy a 30-ounce bottle for no more than $2 at Walmart.

Good luck matching that price at Costco. Even the chain’s house-brand option, Kirkland Signature Moisture Shampoo, costs several times as much for a 33.8-ounce bottle.

To be fair, though, I do buy conditioner at Costco.

7. Grains

Nataliya Sdobnikova / Shutterstock.com

My little household can’t always use up a 12-pound bag of rice or even a 5-pound bag of quinoa before its expiration date passes, so we don’t risk wasting food or money by buying it from a warehouse club.

The bigger rice eater of the household grabs that grain wherever is convenient for him, while I tend to buy quinoa at Walmart — which carries a house brand of organic quinoa.

Disclosure: The information you read here is always objective. However, we sometimes receive compensation when you click links within our stories.

7 Costly Health Problems That Strike After Age 50

Senior woman with injured leg
eakkachai halang / Shutterstock.com

As we age, health issues often creep up that threaten to tarnish our golden years. Treating some of these diseases and conditions can be expensive.

Fortunately, there are ways to cut the cost of such care. Following are some health conditions that tend to strike after age 50 — and how to cut the cost of care if you are diagnosed with them.

Arthritis

Arthritis pain
New Africa / Shutterstock.com

Arthritis strikes about 54.4 million Americans, according to the Centers for Disease Control and Prevention. The CDC adds that in 2013, adults with arthritis on average paid an extra $2,117 in medical costs.

How to cut costs. The Arthritis Foundation has a webpage devoted to ways to trim the tab for arthritis care.

Osteoporosis

Broken bone
Laura v.d. Broek / Shutterstock.com

Around 54 million Americans have low bone density or osteoporosis, according to the National Osteoporosis Foundation. Among women over the age of 50, 1 in 2 will break a bone due to the disease. Among men that age, the figure is 1 in 4.

How to cut costs. One study found that osteoporosis care cost the nation $22 billion in 2008. Prescription medications often are used to treat this condition, so ask your doctor about using less costly generic drugs.

Weight-bearing exercise — such as lifting weights, walking or running, and activities such as tennis — is also a great way to build bone density, and it costs little or nothing to do.

Finally, relatively cheap vitamin D supplements can help your body use calcium and strengthen bones. Ask your doctor if they are right for you.

Diabetes

Diabetes
Vladimir Mulder / Shutterstock.com

More than 34 million Americans have diabetes. Your risk for the disease increases as you age; more than one-quarter of adults ages 65 or older have diabetes.

Diabetes costs the nation $327 billion annually, according to the American Diabetes Association. Patients diagnosed with diabetes bear the brunt of those costs. The Mayo Clinic has noted that the price of insulin for patients is higher in the U.S. than in other countries.

How to cut costs. Getting tested early for diabetes is the key to keeping care costs under control. As the disease progresses, it can become more dangerous — and significantly more expensive to treat.

If you have diabetes, your costs will be lower if your health insurance covers your treatments. The ADA’s Diabetes Forecast magazine has some tips for persuading your insurer to help pay for diabetes devices and supplies.

Finally, a healthful diet and regular exercise can help you control diabetes. In some cases, your efforts might be so effective that you no longer need expensive treatment. The ADA has tips for food and exercise on its website.

Obesity

jakub-cejpek / Shutterstock.com

As the years roll on, our waistlines expand. More than one-third of adults 65 and older are obese, according to a 2007-2010 survey report from the Centers for Disease Control and Prevention. The CDC estimated in a 2009 report that an obese person spent 42% more for health care — an average of $1,429 per person — than people of normal weight.

How to cut costs. Slimming down significantly reduces your risk of being diagnosed with many costly health problems, including diabetes, heart disease, cancer and osteoarthritis.

Switching to a healthful diet and starting an exercise program are inexpensive ways to avoid the costs associated with obesity.

Heart problems

Heart
siam.pukkato / Shutterstock.com

Simply put, heart disease is the leading cause of death for both men and women in the U.S.

This condition encompasses many problems related to atherosclerosis, a narrowing of the arteries due to a buildup of fats, cholesterol and other substances. Heart disease cost the nation $219 billion from 2014 to 2015, according to the CDC.

How to cut costs. Several medical conditions are closely related to a higher risk of developing heart disease. They include:

  • High blood pressure
  • High LDL cholesterol
  • Smoking

A better diet and regular exercise can help you reduce your blood pressure and improve your cholesterol readings. And quitting smoking is among the best ways to both improve your health and save some money.

Declining oral health

Dentist
Dmitry Kalinovsky / Shutterstock.com

About 26% of Americans ages 65 and older have eight or fewer teeth, according to the CDC. That’s a sobering reminder that our oral health begins to slip as we age. The CDC notes that conditions such as severe periodontal disease and oral and pharyngeal cancer primarily affect older adults.

Treating such conditions can be expensive. The cost of dental expenditures reached $136 billion in 2018, according to the American Dental Association.

How to cut costs. Regular visits to the dentist are the best way to catch conditions early, when they are less costly to treat. The ADA notes that while some people should see their dentist just once or twice annually, others may require more frequent visits. Consult with your dentist to find the right schedule for you.

Dental visits can be costly if you do not have dental insurance. The ADA website offers help finding more affordable care.

Shingles

Shingles
one photo / Shutterstock.com

While this illness is likely to be far less costly than others on the list, it deserves attention because it is so prevalent in the over-50 demographic. In fact, half of all cases of shingles are diagnosed in people 60 and older.

And complications related to shingles — from blisters to an ongoing type of pain called post-herpetic neuralgia, or PHN — can take a toll on your wallet.

How to cut costs. Fortunately, there is an easy and affordable fix for shingles: vaccination. As we have reported a new vaccine is more than 90% effective in preventing shingles in folks age 50 and older. For more, check out “Over 50? The CDC Says You Need These 4 Vaccines.”

Disclosure: The information you read here is always objective. However, we sometimes receive compensation when you click links within our stories.

The Latest and Greatest Deals from Around the Web

Photo by Zhu Difeng / Shutterstock.com

Every hour we update this list of the latest and greatest deals from around the web. To have this list, along with our Emmy Award winning news, analysis, and advice delivered daily to your inbox, sign up for our free newsletter.

Last Updated: Saturday 3:00 PM EST.

Categories


Clothing & Accessories (21)

Loungewear at 32 Degrees from $6

Gap Factory Sale: Up to 75% off + extra 10% off + free shipping w/ $50

Columbia Cold Weather Gear: Up to 50% off + free shipping

Uniqlo Men's Light Padded Parka for $20 + free shipping w/ $99

Uniqlo Lunar New Year Deals: over 150 items discounted + free shipping w/ $99

Uniqlo Men's Dress Shirts: Buy 2 or more, get $10 off each + free shipping w/ $99

Uniqlo Men's Ultra Light Down Jacket for $40 + free shipping w/ $99

Uniqlo Men's Distressed Slim-Fit Jeans for $15 + free shipping w/ $99

Under Armour Women's Velocity Twist Hoodie and Storm Fleece Hoodie Bundle for $40 + $5.95 s&h

Under Armour Men's UA Tech 1/2 Zip Pullover for $20 + $5.95 s&h

NFL Shop Clearance Sale: Up to 75% off + free shipping

Canada Weather Gear Boy's Parka System Jacket for $35 + $5.95 s&h

Spyder Girl's Timeless Synthetic Full Zip Jacket for $60 + free shipping

Steve Madden Women's Beaded Anorak Jacket for $30 + $5.95 s&h

Ray-Ban RB4162 Aviator Sunglasses for $60 + free shipping

Winchester Thermal Socks 3-Pack for $5 + $1.49 s&h

New Balance Men's 500 Classic Shoes for $33 + free shipping

Reebok Women's Club C 85 Shoes for $29 + free shipping

Reebok Men's Flashfilm Train 2 Shoes for $34 + free shipping

Reebok Classics Women's Small Logo Low-Impact Bra for $9 + free shipping

Polo Ralph Lauren Men's Water-Repellent Softshell Jacket for $58 + free shipping

Computers (3)

VideoProc for PC and Mac for free + email delivery

Monoprice Essentials 6.6-Foot USB-C to USB-C 3.1 Cable for $3 + free shipping

HP 15-dw3025od Tiger Lake i5 15.6" Laptop for $519 + free shipping

Electronics (5)

Onkyo 5.1-Channel Home Theater System for $319 + free shipping

Klipsch R-26FA Dolby Atmos Speaker Bundle for $999 + free shipping

Apexel 4K HD 5-in-1 Cell Phone Camera Lens Kit for $35 + free shipping

Monoprice 1-Foot Slim High Speed 4K HDMI Cable 3-Pack for $4 + free shipping

Lowepro QuadGuard TX Case for $15 + free shipping

Gaming & Toys (3)

Star Wars The Black Series Supreme Leader Kylo Ren Force FX Elite Lightsaber for $150 + free shipping

Prison Architect for PC or Mac for free

Sid Meier's Civilization Sale at Green Man Gaming: Up to 80% off

Health & Beauty (2)

Xyzal Allergy 24HR: free sample

Xyzal Allergy 24HR: free sample

Spring is just around the corner bringing with it a full arsenal of allergy triggers. Xyzal offers a free sample of its 24-hour medication to help the cause. Fill out the form to get your sample. Shop Now

Tips

  • Use as directed.
  • Limit one order per household.

Features

  • purports to relieve sneezing; itchy, watery eyes; runny nose; itchy nose and throat for 24 hours

ColourPop Sale: Up to 75% off + $5.99 s&h

Home & Garden (16)

Petco End of Season Sale: Up to 65% off + free shipping w/ $35

Petco End of Season Sale: Up to 65% off + free shipping w/ $35

Tigers, and lions, and bears, oh my! Well, maybe your pets are not that exotic, but cats, dogs, fish, and your other pets have needs too; and you can get what you need at Petco during their End of Season Sale. Shop Now at Petco

Tips

  • Up to 65% off clearance.
  • Buy 1, get 1 50% off on select new pet essentials.
  • Buy 2, get 1 free WholeHearted cat treats.
  • Up to 50% off select cold weather apparel and beds.
  • Opt for store pickup to dodge the $5.99 shipping fee, or get free shipping on orders of $35 or more.

Dig Defence Animal Barrier Multipacks at Petco from $33 + free shipping w/ $35

Leiston Leather Dual Power Recliner for $599 + $109 s&h

Reddy Convertible Pet Carrier and Mat for $40 + free shipping

Tommy Hilfiger Modern American Cotton Mix and Match Bath Towel Collection from $4 + free shipping w/ $25

Cuisinart 10-Piece Ceramic-Coated Cutlery Set for $15 + free shipping w/ $25

Instant Pot Instant Ace Plus Cooking & Beverage Blender for $90 + free shipping

Dr. Oz Good Life Say Goodnight Side Sleeper Memory Foam Pillow for $42 + free shipping

Longchamp Cristal D'Arques Crystal Glass 4-Piece Sets for $13 + free shipping w/ $25

Folding Floor Massage Lazy Chair for $108 + free shipping

Nearly Natural 5-Foot Golden Cane Palm Tree for $66 + free shipping

5-Tier Vertical Raised Garden Bed for $80 + free shipping

Lacoste Legend Supima Cotton Towels and Washcloths from $7 + free shipping w/ $25

Monroe II Upholstered Wingback Queen Bed for $279 + shipping varies

Martha Stewart Collection Reversible Towels from $3 + free shipping w/ $25

Martha Stewart Collection Reversible Towels from $3 + free shipping w/ $25

Save on a selection of bath towels, hand towels, & washcloths from the Martha Stewart Collection, with prices starting from $3 and savings of up to $11 off. Shop Now at Macy’s

Tips

  • Washcloths for $2.99 ($7 off)
  • Hand Towels for $3.99 ($8 off)
  • Bath Towels for $4.99 ($11 off)
  • Available in several colors (Biscay Blue pictured).
  • Opt for in-store pickup to avoid the $10.95 shipping charge, otherwise orders of $25 or more bag free shipping.

Features

  • 100% cotton
  • reverses to a solid terry cloth

International Silver 51-Piece Flatware Set for $30 + free shipping

Office & Supplies (1)

School Supplies at Office Depot: Up to 70% off + free next day shipping w/ $60

Disclosure: The information you read here is always objective. However, we sometimes receive compensation when you click links within our stories.