10 of the Best Ways Anyone Can Save on Car Costs

Woman with money in car dealership
RomanR / Shutterstock.com

New or used, sporty or practical, a car keeps wringing money out of its owner throughout its lifetime. Gas, oil changes, accidents — no question, a car is an expensive family member.

But for many of us, a car is also a necessity. Until that “Star Trek” transporter technology arrives, we’ll be driving — and fixing, filling up and coaxing — our cars to keep running for years.

That’s why even the smallest ways to save on car costs are important. From the right insurance policy to simple car-maintenance tips, knowing how to keep your car’s monetary demands at bay can leave more cash in your wallet.

Rev your engines — here are tips for saving on car costs that everyone can use.

1. Shop around for a better rate

hands Blue Toy Car On The Reflective Desk
Andrey_Popov / Shutterstock.com

Switching vehicle insurance companies might save you a bundle.

In “6 Real Ways to Save on Your Car Costs,” Money Talks News writer Miranda Marquit suggests using The Zebra, a car insurance search engine, to get free quotes for changing your coverage.

To use The Zebra, visit the website and enter your ZIP code. Answer some basic questions, and get your quotes. You can also find the best car insurance options listed by state and vehicle. The Zebra does not sell users’ information to third parties or spammers, so you won’t get sales calls from doing a search.

Gabi is another car insurance search engine. In under two minutes, you can easily submit your current insurance policy and let Gabi shop around for the best coverage, delivering as many as 20 quotes.

Or, if you prefer, use The Zebra’s licensed insurance brokers to ask questions and understand your options.

2. Keep tires properly inflated

Orrathai Poolsawat / Shutterstock.com

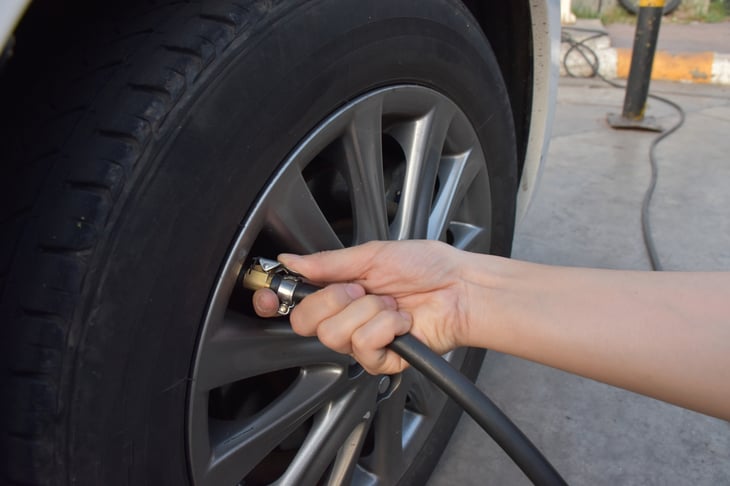
Driving with properly inflated tires can improve your gas mileage by an average of 4%, the Environmental Protection Agency (EPA) reports.

That one improvement will show up at the gas pump.

And it’s easier than ever to do. You can find digital and analog gauges to buy for a few dollars that are easy to use and read. Some newer vehicles may even sport a digital readout of the inflation level for tires.

3. Trim your car insurance premiums

PORTRAIT IMAGES ASIA BY NONWARIT / Shutterstock.com

Take a little time to shave even more off your vehicle insurance bill. Start by reading Money Talks News founder Stacy Johnson’s “How to Get the Best Possible Deal on Car Insurance.”

Next, try these steps:

  • Call your insurance agent. Ask how you can save on your insurance. For example, discuss raising your deductibles (which may lower your premium) or whether it is no longer worthwhile to pay for comprehensive and collision coverage for an older vehicle. Also, ask about getting a deal for bundling your auto insurance with other policies, such as homeowners or renters insurance.
  • Take a defensive driving class. Careful drivers are cheaper to insure. If you’re an AARP member, there’s even an online course you can take. CarInsurance.com says: “[S]tates may require insurers to offer certain discounts to encourage good driver behavior — such as taking defensive driving courses.”

4. Rent out your car to help pay its upkeep

Man in car receiving keys.
Ivanko80 / Shutterstock.com

Get your car to help earn its keep by renting it to other people when you aren’t driving it.

Turo is a car-sharing marketplace, sort of like an Airbnb for vehicles. Turo’s website is where people who want to rent a ride can see what’s available in their area.

Our article “How to Make Extra Money Renting Out Your Car” has the details.

5. Don’t be a car snob

Rawpixel.com / Shutterstock.com

When you buy or lease your next car, think seriously about getting a less-expensive model.

Here’s where you can save thousands of dollars from the start simply by choosing a Mazda over a Mercedes, or a slightly used car over a brand-spanking-new vehicle.

Money Talks News founder Stacy Johnson says he’s never bought a new car, since a new vehicle loses thousands in value the minute you drive it off the lot.

Depreciation can account for nearly 40% of the expense of owning a new vehicle, costing you more than $3,000 per year, Money Talks News reports.

6. Take care of your car

Lemusique / Shutterstock.com

You don’t have to baby your car, but don’t ignore its needs, either.

Regular oil changes, air-filter replacements and even things as simple as new wiper blades can keep it purring longer.

7. Handle small repairs yourself

antoniodiaz / Shutterstock.com

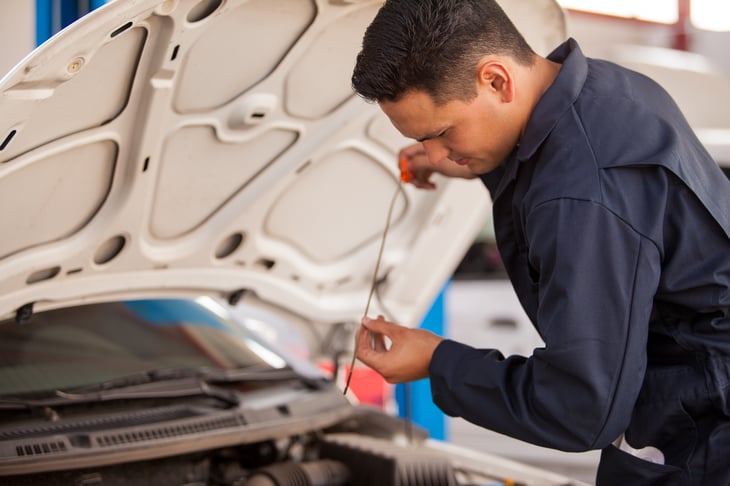
Not everyone is a mechanic. But these days, many simple car-maintenance items can be performed at home by even fairly new drivers.

Oil changes, tire rotations and air-filter replacement don’t really require a professional to do them. Get started by following the steps in “8 Car Repairs and Maintenance Tasks You Can DIY.”

Other good ideas:

  • Ask a handy friend to show you how to do maintenance jobs the first time.
  • Take a basic car know-how course at your community college.

8. Relax your hot foot

Alexandru Nika / Shutterstock.com

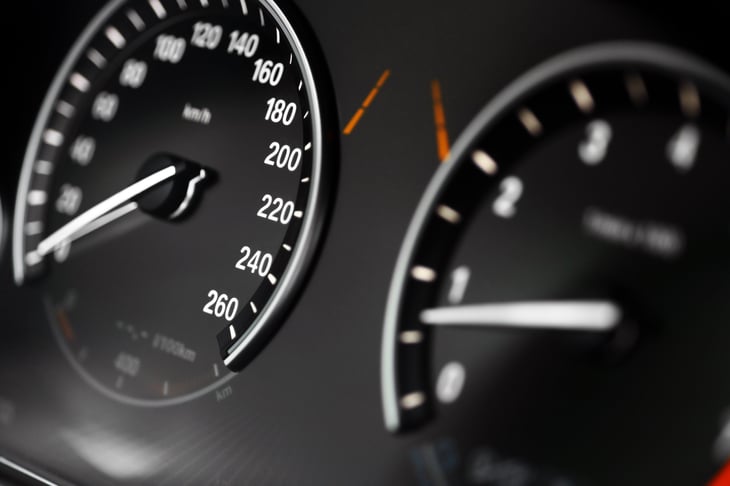
If your speed goes up, your gas mileage will go down. There’s no trophy for being the Mario Andretti of your Minnesota suburb.

Likewise, don’t slam your foot down on your brake pedal either. You’ll extend the life of your brake pads by coasting or easing into stops rather than constantly pounding on the brakes.

9. Use cruise control

Holyshyn Oleh / Shutterstock.com

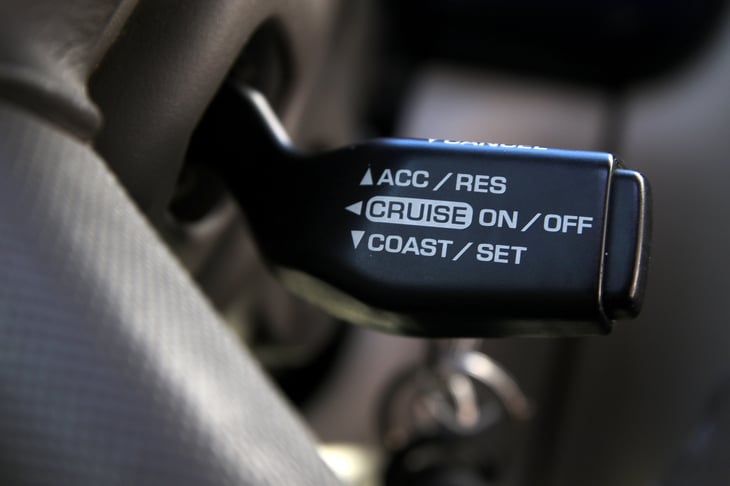
Know how and when to engage your cruise control, and don’t be afraid to use it. AARP estimates doing so can reduce your highway fuel usage by 7%.

Depending on how much you drive and how much of that travel is on the highway, you could save $100 or more annually.

10. Be smart about gas

Vera Petrunina / Shutterstock.com

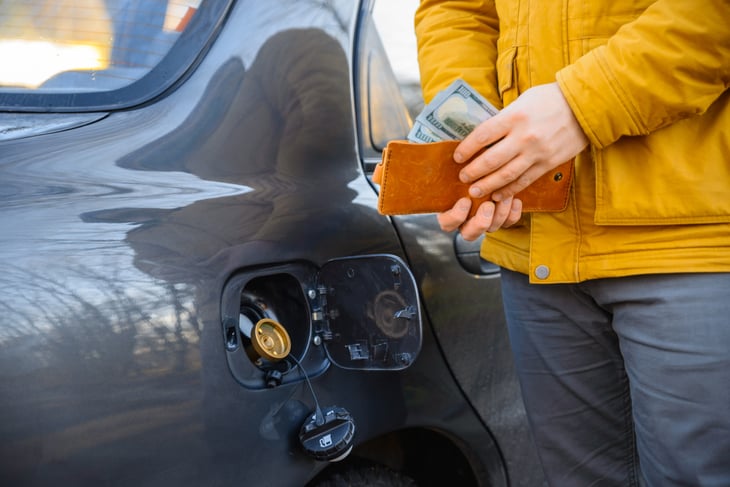
Someday, we may all have electric cars. But until then, gasoline will remain a major part of your car budget.

Be smart about where you buy it and how you pay for it. Many grocery stores or credit cards offer loyalty points that can be used at certain gas stations. Don’t let those go to waste.

Also, try checking into smartphone apps, like GasBuddy, that can help you locate the cheapest price on gas near you.

Disclosure: The information you read here is always objective. However, we sometimes receive compensation when you click links within our stories.

The 10 Most Affordable Cities for an Early Retirement

Senior couple walking in the forest
Kzenon / Shutterstock.com

This story originally appeared on SmartAdvisor Match, by SmartAsset.com.

The COVID-19 pandemic has forced many Americans into an early retirement: In fact, the majority of the seven-percentage-point drop in the labor participation this past spring can be attributed to unemployed people who have prematurely decided to exit the workforce for good, according to a paper from the Becker Friedman Institute for Economics at the University of Chicago.

And though less than 1% of workers in the U.S. ordinarily retire before 50, according to data from the LIMRA Secure Retirement Institute, the rise of the “Financial Independence Retire Early” (FIRE) movement has Americans searching for ways to leave the labor force in advance of what may be the typical age range.

That’s contingent upon such factors as lowering your tax burden and living expenses while also enjoying low housing costs as a percentage of income while working to have the wherewithal to grow your nest egg. With all that in mind, SmartAsset crunched the numbers to uncover the most affordable cities for an early retirement.

To do so, we analyzed 100 of the largest U.S. cities across the following metrics: effective income tax, health insurance costs, cost of living, housing costs as a percentage of income, various other taxes, crime rates, medical facilities and unemployment rate.

For details on our data sources and how we put the information together to create our final rankings, check out the Data and Methodology section at the end.

1. Gilbert, AZ

Gilbert, Arizona
Tim Roberts Photography / Shutterstock.com

Gilbert, Arizona, finishes first in three separate metrics included in this study:

  • Low housing costs as a percentage of income (18.75%).
  • Low violent crime rate (just 97 incidents per 100,000 residents).
  • Low property crime rate (just 1,203 per 100,000 residents).

Gilbert also finishes strong for its September 2020 unemployment rate of 6.3%, ranking 20th overall for this metric.

2. Chandler, AZ

Chandler, Arizona
Mark Skalny / Shutterstock.com

Housing costs in Chandler, Arizona, represent 19.87% of income, the seventh-lowest percentage for this metric in the study.

The average effective property tax rate is 0.55%, the 10th-lowest overall. In addition, the violent crime rate in Chandler is low, with just 228 incidents per 100,000 residents, the eighth-lowest rate for this metric across all 100 cities we analyzed.

3. Scottsdale, AZ

Scottsdale, Arizona
BCFC / Shutterstock.com

Scottsdale, Arizona, has an average effective property tax rate of 0.51%, the sixth-lowest of the 100 cities in this study. It also finishes 13th for housing costs as a percentage of income, at just 20.54%.

Scottsdale has a slightly higher sales tax than the other two Arizona cities in the top three, finishing in the center of the study for this metric, at 8.05%. This indicates that making everyday purchases may prove a bit pricier, even if you’re saving on housing.

4. Boise, ID

Boise, Idaho
Charles Knowles / Shutterstock.com

Boise, Idaho, has a sales tax rate of 6.00%, which ties for the seventh-lowest rate for this metric in the study.

Though Boise ranks in the bottom 10 for its fairly high income tax — with an estimated burden of 21.04% for a retiree with a $50,000 income — the city finishes fifth for its low property crime rate (just 1,579 incidents per 100,000 residents) and 12th for its low unemployment, at 5.9% in September 2020.

5. Lexington, KY

Lexington, Kentucky
Henryk Sadura / Shutterstock.com

Lexington, Kentucky, has a fairly high income tax. The effective rate for a retiree with $50,000 in income is 23.86%, ranking third-highest for this metric in the study.

The city fares better in some of our other metrics, though, including tying for seventh for sales tax, at 6.00%. Lexington also has housing costs that represent 20.38% of income, the 11th-lowest rate across all 100 cities we studied.

6. Plano, TX

Plano Texas
Epiglottis / Shutterstock.com

Plano, a suburb of Dallas, is tied for the study’s lowest effective tax rate for a retiree with an income of $50,000, at just 16.33%. It also has affordable housing. It ranks eighth for housing costs as a percentage of income, at 20.02%.

In addition, Plano is a relatively safe city, finishing in the top 10 for both violent crime incidents (148) and property crime incidents (1,683) per 100,000 residents. That said, Plano doesn’t fare as well in terms of property tax, where the average effective rate is 1.71%, a bottom-quartile ranking for this metric.

7. Colorado Springs, CO

Colorado Springs, Colorado
photo.ua / Shutterstock.com

Colorado Springs has the second-lowest average effective property tax rate in this study, at 0.43%. Colorado Springs’ unemployment rate for September 2020 was 5.9%, which ties for the 12th-lowest rate in the study.

The city has a sales tax of 8.25%, putting it near the middle of the pack for this study (tied for 51st). It also ranks within the top 30 of the study for relatively low housing costs as a percentage of income and average annual cost of a silver health insurance plan for a 60-year-old in the city.

8. Henderson, NV

Henderson, Nevada aerial photo
Khairil Azhar Junos / Shutterstock.com

Henderson, Nevada, is tied for the lowest effective income tax rate for a retiree with an income of $50,000, at 16.33%.

The city is also affordable when it comes to housing. Housing costs represent 20.36% of income, the 10th-lowest rate in the study, and the average effective property tax rate is 0.57%, the 15th-lowest rate in the study.

9. Fort Wayne, IN

Fort Wayne Indiana
Travis Eckert / Shutterstock.com

The Fort Wayne, Indiana, cost of living — the amount needed to cover a single person’s basic needs — comes to $18,904, the third-lowest amount in our study.

Housing is also relatively affordable in Fort Wayne, as housing costs there on average make up just 18.92% of income, also a third-place ranking in our study. That said, the taxes in Fort Wayne are fairly high. The effective rate for a retiree making $50,000 is 20.82%, in the bottom quartile of our study.

10. Mesa, AZ

Mesa, Arizona
Tim Roberts Photography / Shutterstock.com

Mesa, Arizona, has an average effective property tax rate of 0.52%, the seventh-lowest rate for this metric in the study.

The city also finishes in the top quartile for both of its relatively low crime rankings — it places 13th for property crime incidents (1,869 per 100,000 residents) and 23rd for violent crime incidents (377 per 100,000 residents). The downside is that sales tax in the city is fairly high at 8.30%, ranking in the bottom third of the study for this metric.

Data and Methodology

Man analyzing data on a laptop
fizkes / Shutterstock.com

To rank the most affordable cities for an early retirement, we looked at data for 100 cities. Specifically, we compared them over the following 10 metrics.

  • Effective income tax rate. This is the estimated income tax rate for a retiree with $50,000 in annual income. That income is split between $15,000 from Social Security, $10,000 from a private pension, $15,000 from retirement savings like a 401(k) or an IRA, and $10,000 in wages.
  • Average annual cost of a silver health insurance plan. To find this number, we used the Kaiser Family Foundation health insurance calculator. We estimated the cost of a silver plan for a 60-year-old in each city, not including any subsidies.
  • Cost of living. This is the cost of living for one person. Data comes from the MIT living wage study.
  • Median housing costs as a percentage of median household income. This is median housing costs divided by median household income. Data comes from the Census Bureau’s 2019 1-year American Community Survey.
  • Average effective property tax rate. This is annual property taxes divided by median home value. Data comes from the Census Bureau’s 2019 1-year American Community Survey.
  • Sales tax. This is the combined state and local sales tax rate.
  • Property and violent crime rates. This is the number of violent property crimes and violent crime rates per 100,000 residents. Data comes from the FBI UCR report and is for 2019.
  • Medical facilities per 1,000 residents. Data comes from the Census Bureau’s County Business Patterns Survey and is for 2018.
  • Unemployment rate. Data comes from the Bureau of Labor Statistics and is for September 2020.

In order to create our final rankings, we first ranked each city in each metric. We then found each city’s average ranking, giving a half weight to both crime metrics and a full weight to every other metric.

Using this average ranking, we created our final score. The city with the best average ranking received a 100 and the city with the worst average score received a zero.

Disclosure: The information you read here is always objective. However, we sometimes receive compensation when you click links within our stories.

Save on Every Single Purchase With These Tricks

Antonio Guillem / Shutterstock.com

Even before the COVID-19 pandemic clobbered our economy, many Americans were struggling to make ends meet. And now, more than ever, it’s important to know all the tricks to avoid creeping costs. Start with this rule: Never pay retail.

These savvy tactics help you make every penny count. A dollar you don’t spend on needs or wants can be working for you in an emergency fund, a health savings account, retirement savings or a college plan for your kid.

1. Use a cash-back shopping site

Computer with "Cash Back" on screen.
one photo / Shutterstock.com

Sites like Rakuten and TopCashback typically get a finder’s fee when they send shoppers to any of thousands of retailers with links on their portal. They split those fees with consumers, so you get a rebate of from 1% to 30% on what you spend through their sites. Swagbucks Shop, which offers shoppers several ways to save, has a cash-back option, too.

How it works: On a cash-back site, type in the name of a retailer, click through to the site and sign up. You’ll typically need to accumulate a minimum amount in rebates ($25, say) before you can cash them in.

After finding the best price and accessing it through a cash-back site, you can add yet another layer of savings if you …

2. Use a rewards credit card

auto expense
pathdoc / Shutterstock.com

Why would you not pay with a rewards card? It’s free money — or hotel or airline points. If you handle the card wisely, the benefits are potentially great.

There are two reasons not to use a rewards card:

  • You tend to carry a card balance. In that case, your priority is finding a card with the lowest interest rate possible.
  • The card has an annual fee. You don’t want to spend more on fees than you’ll reap in rewards although, in some cases, the rewards are enough that it’s worth paying to own the card.

As always, use credit cards wisely: Pay off your entire account balance each month. Otherwise, interest rates can eat up any benefit and can throw you into debt.

Money Talks News’ credit card finder helps you choose a card that’s right for your personal circumstances.

3. Pay with discounted gift cards

Target gift card
Perry Correll / Shutterstock.com

You’ll find tons of gift card resellers offering to buy cards consumers don’t want or can’t afford to keep.

How do you save money using gift cards, you ask? Here’s how: Buy gift cards at a discount from these resellers and then use them to do your shopping. Suppose you’ll be shopping at Target, for instance. Buy discounted Target cards to use at the store, effectively saving 2% to 20% or more on your purchases.

A couple of sources for discounted cards:

  • Aggregator sites like Raise, which point you to good deals. Also at Raise, you can sell gift cards you aren’t using.
  • Multipacks of discounted gift cards, found at warehouse stores like Costco (membership required).

4. Use shopping tools

pixinoo / Shutterstock.com

Shopping apps are another path to savings. Ibotta’s mobile (Android or Apple) app offers rebates for purchases. Use it while shopping to:

  • Upload receipts.
  • Link your store loyalty cards for automatic tracking.
  • Amass points for gift cards and cash (through Venmo or PayPal).

Programs like Drop and Target’s Circle let you track your purchases and receive discounts and/or points to cash in for rewards.

5. Look for coupons

Coupons.com
Sharaf Maksumov / Shutterstock.com

Coupons can save you a bundle, both online and off. Find them through:

  • Coupon websites: A few are RetailMeNot, Savings.com and Coupons.com.
  • Store websites: Download coupons to your store’s loyalty card.
  • Regional publications: I look forward to my monthly local “Good Deals” magazine, with coupons for all kinds of stuff, from ice cream cones to bathtub restoration. Watch for a shopper publication in your area.
  • Valpak: You may receive the familiar blue envelope in the mail; if not, visit Valpak.com and insert your ZIP code.
  • Social media: Follow your favorite retailers, and they’ll often mail you coupons regularly.

6. Be a preferred customer

Ikea Family
AlesiaKan / Shutterstock.com

Everyone’s a VIP these days. To claim your “special” status:

  • Sign up for email lists with favorite companies. You’ll be notified of sales and may get one-time discount codes, too.
  • Join the club. Establishments offering membership programs can include free products, discounts, birthday freebies and other goodies. When you check out at a store, ask if a rewards club exists.
  • Sign up for a store loyalty card. These can earn discounts and possibly points for more savings.
  • Rewards with every purchase. Some retailers go over and above, offering rewards with each purchase you make.

If you’re not a member of Costco and have been wondering whether you should be, check out this special promotional offer for online signups.

7. Hit the dollar store

Trong Nguyen / Shutterstock.com

Certain items should never be purchased at a dollar store.

But if you follow these shopping secrets, dollar stores can have plenty of great deals on other things you need. (Really, how much do you want to pay for a mop bucket, greeting cards, reading glasses or other necessary or handy items?)

Recently I helped my daughter clean and repaint her rental unit. The mop, sponges, cleanser, white vinegar and other supplies all came from a dollar store.

8. Buy secondhand

A woman sells items at a yard sale
Mila Supinskaya Glashchenko / Shutterstock.com

“Used” doesn’t have to mean “shoddy,” as our veteran thrift shopper explains, sharing his best tips.

At thrift stores and yard sales, you may even find clothing with department-store price tags still attached and unopened shrink-wrapped gift items.

Consignment stores are a happy medium between secondhand stores and retail stores. The managers at these places can be discriminating, so you’ll spend less (maybe a lot less) for new-looking goods.

A few more possibilities for pre-owned goods:

  • Craigslist.org is the grandaddy of local secondhand sales sites. Letgo and its affiliate OfferUp are newer additions to this rich world of previously-used items.
  • Facebook has local sales pages: Type in your city or ZIP code and search terms like “yard sale” or “garage sale.”
  • The Freecycle Network has thousands of chapters in the United States with goods people offer free of charge. Or, post an “ask” for something you’re seeking.
  • The Buy Nothing Project, a hyper-local version of Freecycle, is a nonprofit effort to get neighbors to give to neighbors. I’ve seen great stuff offered for free, and, as with Freecycle, you can ask for things you want.

9. Use social buying sites

Kzenon / Shutterstock.com

Need the chimney swept or your windshield replaced? Can’t afford pricey restaurants? Social buying sites — Groupon and LivingSocial are two — offer discounted products, services, activities and even travel packages. The prices can be downright startling, and they offer a cheaper introduction to fun activities like ceramic painting, laser tag or bowling.

Pro tip: For even more savings, access Groupon and Living Social through a cash-back shopping site. Go to Rakuten and others mentioned above and type in “Groupon” or “Living Social” in the search box to enhance your savings.

10. Buy in bulk

Tyler Olson / Shutterstock.com

You don’t have to join a warehouse club to pay less by purchasing in bulk. Other places for bulk pricing:

  • Ask a supermarket manager if you can get a price break for buying an entire case of canned goods.
  • Produce auctions are a great source of sometimes unbelievable deals. Search online for “produce auction near me.”
  • Restaurant supply stores often are open to the public.
  • Check prices in your supermarket’s natural foods section for spices, rolled oats, cornmeal and other bulk goods at substantial discounts.
  • “Ethnic” markets often feature larger-sized options, especially for staples like rice and beans.

And of course, you’ll find discounts at Costco, Sam’s and BJ’s. See “10 Best Buys at Warehouse Clubs” for ways to use your memberships to the fullest.

Disclosure: The information you read here is always objective. However, we sometimes receive compensation when you click links within our stories.

The 15 Best-Paying Cities for Real Estate Agents

Real estate agent
ESB Professional / Shutterstock.com

This story originally appeared on Inspection Support Network.

Even before the COVID-19 pandemic, real estate agents were adopting new technologies as a way to connect with young, tech-savvy homebuyers. However, like so many other economic sectors, the real estate industry has been forced to expand these practices in response to social-distancing measures taken to reduce exposure to the coronavirus.

Now, virtual open houses and watch parties are the norm, and even formerly non-tech-savvy agents are embracing online document software and drone photography to comply with new restrictions.

Even with recent economic disruptions and high levels of unemployment, the real estate industry remains strong. And data from the S&P/Case-Shiller U.S. National Home Price Index reveals that home prices — fueled by strong demand and a limited supply — continue to rise.

To identify the best-paying metropolitan areas for real estate agents, researchers at Inspection Support Network (ISN) analyzed data from the U.S. Bureau of Labor Statistics and U.S. Bureau of Economic Analysis to calculate cost-of-living-adjusted median annual wages. In expensive metros, wages for real estate agents were adjusted down to reflect less purchasing power; whereas, in more affordable locations, wages were adjusted up to reflect greater purchasing power.

ISN also calculated the relative concentration of real estate agents in each location compared with the U.S. average.

The highest-paying cities for real estate agents are dispersed throughout the country and represent a diverse set of cities. Real estate agents looking for high pay can choose between a number of metros in every region of the country.

However, one important caveat is that this analysis draws from data collected prior to the pandemic, and the subsequent changes to the real estate market could have lasting effects on where future buyers are searching for homes.

Following are metros with the highest cost-of-living-adjusted wages for real estate agents.

15. San Diego-Carlsbad, CA

The skyline of San Diego, where median rent is well below median mortgage payments
Dancestrokes / Shutterstock.com
  • Median wage for real estate agents (adjusted): $57,723
  • Median wage for real estate agents (unadjusted): $67,190
  • Median wage for all workers (unadjusted): $45,050
  • Cost of living (compared with U.S. average): +16.4%
  • Concentration of real estate agents (compared with U.S. average): -53.0%

14. San Jose-Sunnyvale-Santa Clara, CA

San Jose California
Uladzik Kryhin / Shutterstock.com
  • Median wage for real estate agents (adjusted): $58,462
  • Median wage for real estate agents (unadjusted): $75,650
  • Median wage for all workers (unadjusted): $61,980
  • Cost of living (compared with U.S. average): +29.4%
  • Concentration of real estate agents (compared with U.S. average): -55.0%

13. Detroit-Warren-Dearborn, MI

Aerial view of downtown Detroit
Andrey Bayda / Shutterstock.com
  • Median wage for real estate agents (adjusted): $58,565
  • Median wage for real estate agents (unadjusted): $55,930
  • Median wage for all workers (unadjusted): $41,620
  • Cost of living (compared with U.S. average): -4.5%
  • Concentration of real estate agents (compared with U.S. average): -46.0%

12. Boston-Cambridge-Nashua, MA-NH

Boston, Massachusetts
Roman Babakin / Shutterstock.com
  • Median wage for real estate agents (adjusted): $59,387
  • Median wage for real estate agents (unadjusted): $67,820
  • Median wage for all workers (unadjusted): $53,300
  • Cost of living (compared with U.S. average): +14.2%
  • Concentration of real estate agents (compared with U.S. average): -46.0%

11. Birmingham-Hoover, AL

Birmingham, Alabama
Sean Pavone / Shutterstock.com
  • Median wage for real estate agents (adjusted): $59,628
  • Median wage for real estate agents (unadjusted): $52,890
  • Median wage for all workers (unadjusted): $38,020
  • Cost of living (compared with U.S. average): -11.3%
  • Concentration of real estate agents (compared with U.S. average): +38.0%

10. Memphis, TN-MS-AR

Memphis, Tennessee
Steven Frame / Shutterstock.com
  • Median wage for real estate agents (adjusted): $60,543
  • Median wage for real estate agents (unadjusted): $54,610
  • Median wage for all workers (unadjusted): $35,540
  • Cost of living (compared with U.S. average): -9.8%
  • Concentration of real estate agents (compared with U.S. average): -29.0%

9. Sacramento–Roseville–Arden-Arcade, CA

Sacramento, California
Ed Gavryush / Shutterstock.com
  • Median wage for real estate agents (adjusted): $61,245
  • Median wage for real estate agents (unadjusted): $63,450
  • Median wage for all workers (unadjusted): $44,590
  • Cost of living (compared with U.S. average): +3.6%
  • Concentration of real estate agents (compared with U.S. average): -51.0%

8. Austin-Round Rock, TX

Traffic in Austin, Texas
Philip Lange / Shutterstock.com
  • Median wage for real estate agents (adjusted): $61,747
  • Median wage for real estate agents (unadjusted): $61,870
  • Median wage for all workers (unadjusted): $41,560
  • Cost of living (compared with U.S. average): +0.2%
  • Concentration of real estate agents (compared with U.S. average): +60.0%

7. New York-Newark-Jersey City, NY-NJ-PA

New York City coastline
IM_photo / Shutterstock.com
  • Median wage for real estate agents (adjusted): $65,802
  • Median wage for real estate agents (unadjusted): $81,660
  • Median wage for all workers (unadjusted): $48,840
  • Cost of living (compared with U.S. average): +24.1%
  • Concentration of real estate agents (compared with U.S. average): -47.0%

6. Houston-The Woodlands-Sugar Land, TX

Houston, Texas
Sean Pavone / Shutterstock.com
  • Median wage for real estate agents (adjusted): $67,348
  • Median wage for real estate agents (unadjusted): $68,560
  • Median wage for all workers (unadjusted): $40,570
  • Cost of living (compared with U.S. average): +1.8%
  • Concentration of real estate agents (compared with U.S. average): +47.0%

5. Pittsburgh, PA

Pittsburgh, Pennsylvania
Sean Pavone / Shutterstock.com
  • Median wage for real estate agents (adjusted): $68,120
  • Median wage for real estate agents (unadjusted): $63,420
  • Median wage for all workers (unadjusted): $40,570
  • Cost of living (compared with U.S. average): -6.9%
  • Concentration of real estate agents (compared with U.S. average): +31.0%

4. Las Vegas-Henderson-Paradise, NV

Las Vegas neighborhood with desert hills beyond.
Christopher Boswell / Shutterstock.com
  • Median wage for real estate agents (adjusted): $70,671
  • Median wage for real estate agents (unadjusted): $68,410
  • Median wage for all workers (unadjusted): $35,660
  • Cost of living (compared with U.S. average): -3.2%
  • Concentration of real estate agents (compared with U.S. average): +63.0%

3. Dallas-Fort Worth-Arlington, TX

Dallas, Texas
Sean Pavone / Shutterstock.com
  • Median wage for real estate agents (adjusted): $70,884
  • Median wage for real estate agents (unadjusted): $71,380
  • Median wage for all workers (unadjusted): $40,430
  • Cost of living (compared with U.S. average): +0.7%
  • Concentration of real estate agents (compared with U.S. average): +29.0%

2. Denver-Aurora-Lakewood, CO

Denver Colorado
Kevin Ruck / Shutterstock.com
  • Median wage for real estate agents (adjusted): $74,404
  • Median wage for real estate agents (unadjusted): $78,050
  • Median wage for all workers (unadjusted): $47,440
  • Cost of living (compared with U.S. average): +4.9%
  • Concentration of real estate agents (compared with U.S. average): +41.0%

1. Rochester, NY

Rochester, New York
Sirichai netthong / Shutterstock.com
  • Median wage for real estate agents (adjusted): $74,821
  • Median wage for real estate agents (unadjusted): $73,100
  • Median wage for all workers (unadjusted): $40,070
  • Cost of living (compared with U.S. average): -2.3%
  • Concentration of real estate agents (compared with U.S. average): -73.0%

Methodology & Detailed Findings

Man analyzing data on a laptop
fizkes / Shutterstock.com

The wage and employment data used in this analysis is from the U.S. Bureau of Labor Statistics 2019 Occupational Employment Survey, which covers wage and salary workers in non-farm establishments. The cost-of-living data is from the U.S. Bureau of Economic Analysis Regional Price Parities.

To identify the best-paying locations for real estate agents, cost-of-living-adjusted median annual wages were calculated. In expensive locations, wages were adjusted down to reflect lower purchasing power; whereas, in more affordable locations, wages were adjusted up to reflect more purchasing power.

Researchers also included the relative concentration of real estate agents in each location compared with the U.S. average. This statistic is the percentage difference between the concentration of real estate agents in the given location and the concentration of real estate agents in the U.S. as a whole.

Only metropolitan areas with at least 100,000 residents and available data from the BLS were included in the analysis.

Disclosure: The information you read here is always objective. However, we sometimes receive compensation when you click links within our stories.

10 Cities With the Best Work-Life Balance for 2021

man relaxing work life balance
Andreas Saldavs / Shutterstock.com

This story originally appeared on SmartAsset.com.

For most people, working is inevitable: You need a job to afford your lifestyle. The trick, of course, is to find a balance where you can earn the money you need without spending all of your time in the workplace. Some of that depends on what the work culture is like in your city, how much you need to earn to pay for housing, and how long you have to spend getting to work. To that end, SmartAsset analyzed 100 of the biggest cities in the country to find the best cities for work-life balance for 2021.

To do so, we considered data on the following metrics: walk score; arts, entertainment and recreation establishments as a percentage of all establishments; restaurants as a percentage of all establishments; housing costs as a percentage of income; average weeks worked per year; average hours worked per week; average commute time; percentage of workers with a commute longer than 60 minutes; and October 2020 unemployment rate and labor force participation rate. For details on our data sources and how we put all the information together to create our final rankings, check out the Data and Methodology section at the end.

This is SmartAsset’s fourth study on the cities with the best work-life balance. Read the 2020 version here.

1. Madison, WI

Madison, Wisconsin
MarynaG / Shutterstock.com

For the second year in a row, Madison, Wisconsin, is the best city in America for work-life balance. Madison doesn’t lead in any categories, but it does finish in the top 10% of the study for six of the 10 metrics. This includes coming in second-lowest for average hours worked per week (36.4), third-lowest for October 2020 unemployment rate (3.9%), and sixth-highest for labor force participation rate (73.2%).

2. Virginia Beach, VA

Ritu Manoj Jethani / Shutterstock.com

Virginia Beach, Virginia, ranks in the top 10% of this study for two metrics: fourth-highest for restaurants as a percentage of all establishments (10.10%) and sixth-lowest for October 2020 unemployment rate (4.7%). The beach town also ranks in the top 20% of the study for two other metrics: 14th-best for labor force participation rate (71.9%) and 17th-best for arts, entertainment, and recreation establishments as a percentage of all establishments (1.88%).

3. Minneapolis, MN

Lake Calhoun, Minneapolis
Roger Siljander / Shutterstock.com

Minneapolis is the first Minnesota city to make this list, and it does so on the back of finishing in the top five for two different metrics: third for a strong labor force participation rate (74.9%) and fifth for a low October 2020 unemployment rate (4.5%). Minneapolis also places 12th-best in terms of housing costs as a percentage of income at 29.43%.

4. Lincoln, NE

Lincoln, Nebraska
Mark Dahmke / Shutterstock.com

Lincoln, Nebraska, has the lowest October 2020 unemployment rate in the study, at just 2.7%. Lincoln also finishes second for the best commute time, an average of just 18.4 minutes, and places sixth-lowest for the percentage of commuters with a commute of longer than 60 minutes, just 2.7%. Lincoln finishes near the bottom of the study, though, in terms of the average weeks worked per year, at 39.65.

5. Omaha, NE

Omaha, Nebraska
EQRoy / Shutterstock.com

Another Nebraska city is next — the state’s largest metro, Omaha. The unemployment rate there in October 2020 was 3.3%, the second-lowest in the study — giving the top two spots in that metric to Nebraska cities. Omaha also places eighth-best in terms of average commute time. The average commuter in Omaha spends just 20.1 minutes in transit, a far cry from the traffic-packed streets of some bigger cities. Omaha residents do work much of the year, finishing in the bottom quartile with 38.47 weeks worked per year.

6. Arlington, VA

Arlington, Virginia
Sean Pavone / Shutterstock.com

Arlington, Virginia, is a suburb of Washington, D.C., and it has the highest labor force participation rate in this study, 78.0%. Arlington also ranks second-lowest in the study for housing costs as a percentage of income — housing costs make up just 26.14% of income on average. People do work a lot in the town, though. Arlington ranks dead last in both the metrics measuring how much people work — an average of 41.3 hours per week and 41.80 weeks per year.

7. St. Paul, MN

St Paul Minnesota
Henryk Sadura / Shutterstock.com

St. Paul, Minnesota, joins its “Twin Cities” neighbor, Minneapolis, on this list and ranks in the top 10% of this study for three different metrics:

  • Fourth for average hours worked per week (36.8)
  • Sixth for October 2020 unemployment rate (4.7%)
  • 10th for arts, entertainment, and recreation establishments as a percentage of all establishments (2.04%)

8. Columbus, OH

Columbus, Ohio
Randall Vermillion / Shutterstock.com

Columbus, Ohio, comes in sixth for housing costs as a percentage of income, at 27.53%. That is the only metric for which Columbus places in the top 10, but it does finish 11th-best for labor force participation rate (72.4%) and 20th-best for October 2020 unemployment rate (5.4%). Columbus finishes in the bottom quartile of this study for the metric measuring how many weeks per year people work on average, at 38.16.

9. Durham, NC

Sean Pavone / Shutterstock.com

In Durham, North Carolina, just 2.7% of workers have a commute of at least an hour, the sixth-lowest total for this metric in the study. The average commute in Durham is 22.6 minutes, the 25th-lowest time spent traveling to work that we observed overall. Durham is not a particularly walkable city, however, finishing in the bottom 10% of the study in terms of walk score.

10. Lexington-Fayette, KY

Lexington, Kentucky
Henryk Sadura / Shutterstock.com

Lexington-Fayette is the final entry in our top 10, and it finishes in the top 15% for three metrics:

  • 14th for arts, entertainment, and recreation establishments as a percentage of all establishments (1.95%)
  • 14th for average commute time (21 minutes)
  • 15th for housing costs as a percentage of income (29.66%)

Lexington suffers when it comes to walkability, though, finishing in the bottom quartile of the study in terms of walk score.

Data and Methodology

A young woman reading carefully on her laptop
Rawpixel.com / Shutterstock.com

To find the best cities for work-life balance, we compared 100 of the largest cities in America across the following metrics:

  • Walk score. Data comes from walkscore.com and is for 2020.
  • Concentration of arts, entertainment, and recreation establishments. This is the number of arts, entertainment, and recreation establishments as a percentage of all establishments. Data comes from the Census Bureau’s 2018 County Business Patterns Survey.
  • Concentration of restaurants. This is the number of restaurants as a percentage of all establishments. Data comes from the Census Bureau’s 2018 County Business Patterns Survey.
  • Housing costs as a percentage of income. This is the median housing cost as a percentage of income for full-time workers. Data comes from the Census Bureau’s 2019 1-year American Community Survey.
  • Average number of weeks worked per year. This is how many weeks per year local employees work. Data comes from the Census Bureau’s 2019 1-year American Community Survey.
  • Average number of hours worked per week. This is the average number of hours a worker works in a week. Data comes from the Census Bureau’s 2019 1-year American Community Survey.
  • Average commute time. This is the average number of minutes it takes for a worker to commute to work. Data comes from the Census Bureau’s 2019 1-year American Community Survey.
  • Percentage of workers with a commute longer than 60 minutes. Data comes from the Census Bureau’s 2019 1-year American Community Survey.
  • Unemployment rate. Data comes from the Bureau of Labor Statistics and is for October 2020.
  • Labor force participation rate. Data comes from the Census Bureau’s 2019 1-year American Community Survey.

First, we ranked each city in each metric. We then found the average ranking for each city. Walk score, concentration of arts and entertainment establishments, concentration of restaurants, housing costs as a percentage of income, and labor force participation rate received a full weight. Weeks worked per year, hours worked per week, average commute time, and percentage of workers with a commute of more than an hour each received a half weight. Unemployment rate received a double weight. We then ranked the cities based on this average. The top city received an index score of 100 and the bottom city received an index score of 0.

Disclosure: The information you read here is always objective. However, we sometimes receive compensation when you click links within our stories.

7 Top Costly Mistakes Investors Made Last Year

Upset investors talking on the phone
Koldunova Anna / Shutterstock.com

Warning: Big investing mistakes can be hazardous to your wealth.

One or two basic blunders can undermine years of diligent saving and crush your dreams of building life-changing wealth.

Financial professionals see investors make such errors all the time. Recently, they identified the most common of these mistakes as part of the 2020 Natixis Global Survey of Financial Professionals.

Following are some of the costliest mistakes investors likely made in 2020 — and how to avoid them going forward.

Emotional decisions

BlueSkyImages / Shutterstock.com

When the coronavirus swept into the U.S. this spring, it sent the economy into a tailspin. The S&P 500 index plunged 34%, likely taking much of your wealth with it.

Bear markets feel like a body blow. But throughout history, new bull markets always have followed downturns. That is why hitting the panic button and selling in bad times is usually a mistake.

During this spring’s plunge, the market fell to a low on March 23. But if fearful emotions caused you to sell on that day, you missed out on one heck of a party that followed.

From March 23 through April 9, the S&P rose a stunning 25%. The 100-trading-day period after March 23 marked the best S&P performance since 1933, with a rise of more than 50%. And stocks have continued to soar ever since.

As stocks tanked earlier this year, investors in the U.S. sold $327 billion in mutual fund positions, according to Strategic Insight. The lesson? In investing, emotions can be your enemy.

Timing the market

Man timing the market
G-Stock Studio / Shutterstock.com

Let’s return to the bear market of last spring. As stocks were falling, prognosticators everywhere were rising up, telling you exactly what to do with your money.

Chances are, a few of them were right. But likely, it was very few.

Timing the market — which requires knowing exactly when to buy and precisely when to sell — is all but impossible. Numerous studies have shown that almost nobody consistently times the market well over the long haul.

In his book “Common Sense on Mutual Funds,” legendary investor John Bogle — creator of the world’s first index mutual fund — wrote:

“The idea that a bell rings to signal when investors should get into or out of the market is simply not credible. After nearly 50 years in this business, I do not know of anybody who has done it successfully and consistently. I don’t even know anybody who knows anybody who has done it successfully and consistently.”

Not recognizing risk tolerance

Walking a tightrope
Vaclav P3k / Shutterstock.com

There is no way around it: Investing is risky. Over time, the stock market rises. But there are periods — some of them long — when equities crater.

Just in the past 20 years, the S&P 500 has seen three large stock market declines, according to Investopedia:

  • Beginning in March 2000: down 49%
  • Beginning in October 2007: down 56%
  • Beginning in February 2020: down 30%

In each case, markets recovered. Sometimes, the recovery was relatively quick. The bear market of 2020 was a blip, lasting just one month.

But in other cases, recovery was a slog. The bear that growled its way onto the stage in March 2000 stayed put for 31 months.

Natixis points out that 56% of investors say they are willing to take on risk to get ahead, yet more than three-quarters say they really prefer safety over investment performance.

So, before you invest, understand exactly how much risk you are willing to take — and what you will do if things do not work out as planned.

Unrealistic expectations

Woman with money, looking stupid
Liudmila P. Sundikova / Shutterstock.com

It’s a safe bet that if you are reading this article, you hope to get rich someday. Or, at least you hope to achieve some measure of financial security.

Here’s the good news: If you save diligently and invest wisely over time, you will almost certainly increase your wealth — possibly to levels that exceed your wildest dreams.

But doing so takes time. Trying to make a quick killing in the market is likely to leave you disappointed. So is expecting wildly high returns of 20% annually.

Be patient. Keep your short-term expectations modest, and let the long term take care of itself. As we wrote in “10 Characteristics of Wildly Successful People“:

“If you aren’t willing to put in the hours and make some sacrifices, you might as well get accustomed to mediocrity. The best things in life — whether that’s money in the bank or a great relationship with your spouse or child — typically come only with significant effort.”

Taking too much risk

Bull and bear
Bacho / Shutterstock.com

As we pointed out earlier, uncertainty is part of investing. It is difficult to get rich without taking on some risk. Money Talks News founder Stacy Johnson is fond of saying you can’t get a hit from the dugout.

However, taking on too much risk can lead to disaster. It’s important to strike a balance. As Stacy says, you should never invest money you will need in the next five years, and you should not invest everything you have into the market — ever. He writes:

“One rule of thumb I’ve been advocating for decades is to subtract your age from 100, then put the difference as a percentage of your money in stocks. So if you’re 20, you can invest up to 80% in stocks. If you’re 80, 20%. If you’re nervous, invest less. It’s just a rule of thumb.”

For more, check out “7 Ways to Slay Your Fear of the Stock Market.”

Not recognizing the euphoria of an up market

Excited woman at a computer
fizkes / Shutterstock.com

When times are good, it is easy to think sunny skies will stretch on forever.

Investors who see a 10% gain in stocks over a period of six months are much more likely to expect their investments to continue to rise in the future, according to research from the Natixis Center for Investor Insight and the Massachusetts Institute of Technology.

But while it may seem counterintuitive, the more stock prices rise, the greater the danger is that a fall is on the horizon. By contrast, when stocks have plummeted — and nobody wants them — they are likely to be a safer purchase.

Those truths are at the root of one of the stock market’s oldest maxims: “Buy low, sell high.” But instead of trying to figure out when to buy and sell, simply invest for the long haul.

As legendary investor Warren Buffett says, “consistently buy an S&P 500 low-cost index fund. Keep buying it through thick and thin, and especially through thin.”

Failing to think about taxes when selling

Uncle Sam and taxes
Sean Locke Photography / Shutterstock.com

Ah, taxes: They are preferable to that other famous “inevitable” in life (death), but they still stink.

Most of us try to keep our tax obligation small. But as the folks at Natixis point out, each time you sell stock shares, you are locking yourself into paying taxes on any gains you may have accumulated. According to Natixis:

“Three-quarters of investors may say they consider tax implications when making investment decisions, but their behavior in periods of stress may actually trigger unintended taxable events. For example, a big sell-off in your portfolio could lock in gains at a time when markets are declining rapidly.”

So, Natixis encourages you to think strategically before selling. Even carefully weighing which holding you should sell first can make a big difference to how much you will owe Uncle Sam on Tax Day.

Disclosure: The information you read here is always objective. However, we sometimes receive compensation when you click links within our stories.

15 Cities With the Most Minority-Owned Startups

minority business owner
Rawpixel.com / Shutterstock.com

This story originally appeared on Self.

In addition to being a critical driver of growth in the economy overall, entrepreneurship is one of the many ways that individuals can build wealth in America. But as 2020 illustrated, opportunities to participate and succeed in the entrepreneurial economy are not equally distributed by race and ethnicity.

Last year, a wave of racial justice protests nationwide and the economic repercussions of the COVID-19 pandemic drew more attention to the struggles that minority communities face in building and sustaining wealth. According to a McKinsey analysis, two of the primary challenges facing minority business owners are structural barriers to financial health and disproportionate representation in industries most susceptible to economic shocks like those presented by COVID-19.

Despite all these challenges, today there are nearly 170,000 minority-owned startups in the U.S., employing over 700,000 people and generating close to $100 billion in annual revenue. Based on demographic trends, these numbers are likely to grow as the population continues to diversify on racial and ethnic lines. Unsurprisingly, states with higher minority populations — including “majority-minority” California and Hawaii — also lead in the percentage of startups that are minority-owned.

At the city level, the story is much the same. While areas with large minority populations also tend to have higher concentrations of minority-owned startups, minorities remain underrepresented in small-business ownership relative to their population levels. To show this trend, researchers at Self Financial used U.S. Census Bureau data to calculate the percentage of startup businesses — defined as firms less than 2 years old — that are minority-owned and the minority population share in each metro area. Researchers also included each metro’s total number of minority-owned startups, along with their number of employees and total annual sales.

Keep reading for the large metros with the most minority-owned startups.

15. Richmond, VA

Richmond, Virginia
ESB Professional / Shutterstock.com
  • Percentage of startups that are minority-owned: 19.56%
  • Number of startups that are minority-owned: 617
  • Total employees at minority-owned startups: 2,976
  • Annual sales at minority-owned startups: $260,076,000
  • Minority population share: 42.71%

14. Chicago-Naperville-Elgin, IL-IN-WI

Dream Master / Shutterstock.com
  • Percentage of startups that are minority-owned: 20.37%
  • Number of startups that are minority-owned: 5,275
  • Total employees at minority-owned startups: 19,635
  • Annual sales at minority-owned startups: $2,785,820,000
  • Minority population share: 47.10%

13. Baltimore-Columbia-Towson, MD

Baltimore, Maryland
sean-pavone / Shutterstock.com
  • Percentage of startups that are minority-owned: 22.39%
  • Number of startups that are minority-owned: 1,460
  • Total employees at minority-owned startups: 5,053
  • Annual sales at minority-owned startups: $764,077,000
  • Minority population share: 43.45%

12. Seattle-Tacoma-Bellevue, WA

Seattle
Albert Pegp / Shutterstock.com
  • Percentage of startups that are minority-owned: 22.66%
  • Number of startups that are minority-owned: 2,937
  • Total employees at minority-owned startups: 13,133
  • Annual sales at minority-owned startups: $1,576,032,000
  • Minority population share: 36.72%

11. Las Vegas-Henderson-Paradise, NV

Las Vegas homes
trekandshoot / Shutterstock.com
  • Percentage of startups that are minority-owned: 23.80%
  • Number of startups that are minority-owned: 1,624
  • Total employees at minority-owned startups: 5,946
  • Annual sales at minority-owned startups: $926,653,000
  • Minority population share: 57.23%

10. Orlando-Kissimmee-Sanford, FL

Sean Pavone / Shutterstock.com
  • Percentage of startups that are minority-owned: 23.89%
  • Number of startups that are minority-owned: 2,279
  • Total employees at minority-owned startups: 6,472
  • Annual sales at minority-owned startups: $920,034,000
  • Minority population share: 53.32%

9. Dallas-Fort Worth-Arlington, TX

Aneese / Shutterstock.com
  • Percentage of startups that are minority-owned: 24.12%
  • Number of startups that are minority-owned: 5,190
  • Total employees at minority-owned startups: 25,714
  • Annual sales at minority-owned startups: $3,382,747,000
  • Minority population share: 53.97%

8. St. Louis, MO-IL

f11photo / Shutterstock.com
  • Percentage of startups that are minority-owned: 25.03%
  • Number of startups that are minority-owned: 2,279
  • Total employees at minority-owned startups: 4,019
  • Annual sales at minority-owned startups: $193,558,000
  • Minority population share: 26.27%

7. Washington-Arlington-Alexandria, DC-VA-MD-WV

Washington, D.C.
orhan-cam / Shutterstock.com
  • Percentage of startups that are minority-owned: 29.23%
  • Number of startups that are minority-owned: 4,599
  • Total employees at minority-owned startups: 16,729
  • Annual sales at minority-owned startups: $2,480,180,000
  • Minority population share: 54.50%

6. New York-Newark-Jersey City, NY-NJ-PA

NYC New York City skyline at night
Songquan Deng / Shutterstock.com
  • Percentage of startups that are minority-owned: 29.93%
  • Number of startups that are minority-owned: 22,544
  • Total employees at minority-owned startups: 67,660
  • Annual sales at minority-owned startups: $11,803,829,000
  • Minority population share: 54.14%

5. Houston-The Woodlands-Sugar Land, TX

Houston, Texas skyline
Silvio Ligutti / Shutterstock.com
  • Percentage of startups that are minority-owned: 30.45%
  • Number of startups that are minority-owned: 5,599
  • Total employees at minority-owned startups: 22,735
  • Annual sales at minority-owned startups: $3,145,123,000
  • Minority population share: 63.85%

4. San Antonio-New Braunfels, TX

San Antonio at night.
f11 photo / Shutterstock.com
  • Percentage of startups that are minority-owned: 30.86%
  • Number of startups that are minority-owned: 1,675
  • Total employees at minority-owned startups: 8,871
  • Annual sales at minority-owned startups: $1,076,705,000
  • Minority population share: 66.32%

3. Riverside-San Bernardino-Ontario, CA

Riverside, California at night
MattGush / Shutterstock.com
  • Percentage of startups that are minority-owned: 34.07%
  • Number of startups that are minority-owned: 3,540
  • Total employees at minority-owned startups: 19,527
  • Annual sales at minority-owned startups: $2,013,083,000
  • Minority population share: 67.88%

2. Los Angeles-Long Beach-Anaheim, CA

The streets of Los Angeles, where median rent is relatively low
Sean Pavone / Shutterstock.com
  • Percentage of startups that are minority-owned: 34.70%
  • Number of startups that are minority-owned: 17,221
  • Total employees at minority-owned startups: 69,107
  • Annual sales at minority-owned startups: $11,788,812,000
  • Minority population share: 70.36%

1. San Jose-Sunnyvale-Santa Clara, CA

San Jose California
Uladzik Kryhin / Shutterstock.com
  • Percentage of startups that are minority-owned: 46.01%
  • Number of startups that are minority-owned: 2,796
  • Total employees at minority-owned startups: 11,469
  • Annual sales at minority-owned startups: $1,808,320,000
  • Minority population share: 68.38%

Detailed Findings & Methodology

a man reads his free credit report
ESB Professional / Shutterstock.com

The data used in this analysis is from the U.S. Census Bureau’s Annual Business Survey, which includes all U.S. businesses with paid employees. To identify the locations with the most minority-owned startup businesses, researchers calculated the percentage of all startup businesses (firms less than 2 years old) that are minority-owned. The researchers also calculated the minority population share of each geographic region (defined as the percentage of the total population that does not identify as non-Hispanic white) by using data from the U.S. Census Bureau’s 2019 American Community Survey.

To improve relevance, only metropolitan areas with at least 100,000 residents were included. Additionally, metros were grouped into cohorts based on population size: small (100,000–349,999), midsize (350,000–999,999), and large (1 million or more).

Disclosure: The information you read here is always objective. However, we sometimes receive compensation when you click links within our stories.

6 Things Retirees Wish They Had Done Differently

Thoughtful seniors plan for retirementThoughtful seniors plan for retirement
RossHelen / Shutterstock.com

This story originally appeared on NewRetirement.

Many retirees complete their last day of work only to find that they can’t afford to live comfortably. Looking back, they point to clear planning steps they could have taken that would have made a dramatic impact on being prepared for retirement.

Here are several ways today’s retirees say they would have planned differently, and what you can do while there is still time.

1. Save More

saving moneysaving money
Dean Drobot / Shutterstock.com

According to an annual study by the Transamerica Center for Retirement Studies, a full 78% of retirees wish they would have saved more. Retirees who were less confident about their financial situations say not saving was a major regret.

Other savings regrets included not making the most of their 401(k) plan, not enrolling in the plan early enough, and not saving the maximum amount allowed by their plan.

Too many soon-to-be retirees put off retirement saving, says Kerry Soudan with TREW Financial & Benefits Group Inc., which has offices in Chicago’s North Shore suburbs and Las Vegas. “A lot of people wait until the very end when they retire to start planning for retirement,” Soudan says.

2. Document an Overall Plan

Happy senior planning retirementHappy senior planning retirement
Monkey Business Images / Shutterstock.com

The research is clear. A written financial plan is likely to make you feel more confident about your finances (the Schwab Modern Wealth Survey showed that 63% of people with a written financial plan say they feel financially stable while only 28% of those with a plan feel the same level of comfort).

However, the Transamerica research found that only 18% of retirees have a written plan. Whether you are far from, approaching, or already in retirement, a written plan will help put your worries to rest.

And creating a written plan is easy. The NewRetirement Planner can help. Forbes Magazine calls it “a new approach to retirement planning.” It is comprehensive, reliable, and will help you discover opportunities for more wealth and security.

3. Plan More Carefully for the Fun You Want to Have in Retirement

A retired couple celebrates their freedom at the beachA retired couple celebrates their freedom at the beach
goodluz / Shutterstock.com

Two-thirds of pre-retirees (68%) have not completed a budget of anticipated income and expenses, according to Fidelity Investments.

Retirees can really underestimate how much retirement fun will cost, says Mike Niemczyk with MLN Retirement Planning Inc., with offices in Grayslake, Illinois, and McHenry County, Illinois. While many older Americans believe once they retire they’ll spend less as a result of having a lower income, financial experts say most retirees often spend more in at least the first few years of retirement.

“We find now that retirees are going out and spending more — dinner with friends, vacations,” Niemczyk says.

When helping clients budget for retirement, Soudan asks what they enjoy doing on the weekend.

“They might say, ‘Golf and then go out to dinner,’” Soudan says. “I tell them, ‘When you retire, every day is Saturday. You have to think about what it’s going to take to live like it’s Saturday seven days a week.’”

“They didn’t plan ahead of time,” Niemczyk says of the challenges many clients face. “Many are running out of money before running out of life.”

Explore the best ways to create a reliable retirement budget.

4. Plan for Health Care

Couple with financial adviserCouple with financial adviser
imtmphoto / Shutterstock.com

Not being able to afford dinner out is a surmountable problem. A bigger issue is knowing if you can afford health care.

According to a 2013 report by AARP, “only about one-third (36%) have tried to estimate how much money they will need to save and have set money aside to cover these expenses in the future. Adults age 60-64 (40%) are just slightly more likely than those age 50-59 (35%) to have money set aside although these differences are not statistically significant.”

Two-thirds of respondents have thought about the costs at least somewhat, but only 52% are confident they can afford the costs. In fact, less than 2 in 10 (16%) are very confident that they can afford the costs of health care in retirement.

Before you retire, you should get a reasonable estimate of your health care costs and make sure you can afford them. Medicare does not cover everything, and most people spend hundreds of thousands of dollars in out of pocket health care expenses in retirement — not even including funding a long-term care need.

The NewRetirement Planner can give you a personalized estimate for health care costs. It also helps you figure out how to plan for a possible long-term care need.

5. Learn More About Personal Finance

Senior couple making retirement plans with adviserSenior couple making retirement plans with adviser
Alexander Raths / Shutterstock.com

The Transamerica research suggests that a full 66% of retirees wish they were and had been more knowledgeable about financial planning.

There are a lot of considerations, ranging from investing and budgeting to debt and taxes. Good thing you are reading articles like this one!

6. Plan and Make Moves to Protect Money from Taxes

Taxes are a major consideration for retirees. Uncle Sam can take a big bite out of your nest egg.

“Many older Americans with 401(k) plans don’t realize those monies are taxed when cashed out,” Soudan says. “If you have half a million in your 401(k) you might be hit with a 30% to 40% tax,” he adds. However, with proper planning, there is a lot you can do to protect your money from taxes.

It takes forethought, but Roth conversions, taxable income shifts and other strategies can result in significant lifetime savings.

Disclosure: The information you read here is always objective. However, we sometimes receive compensation when you click links within our stories.

7 Products With Price Spikes on Amazon Amid the Pandemic

Angry woman using a laptop
ViDI Studio / Shutterstock.com

The coronavirus crisis wasn’s a plague for Amazon’s business in 2020. Founder and CEO Jeff Bezos’ wealth grew 63%, the company’s stock price rose 73%, and people are jumping on the Prime train at a record pace.

Many people are staying home to prevent getting COVID-19 and using Amazon to deliver nearly everything under the sun. But as demand for deliveries has risen, so have the prices of some products, according to a recent report by the U.S. Public Interest Research Group’s Education Fund.

The nonprofit analyzed 15 product categories, looking at the prices of 50 essential products in each category. The products examined were fulfilled by Amazon, a third-party or both.

The U.S. PIRG Education Fund discovered that, of the 750 products it analyzed, prices of 136 at least doubled and 409 increased by more than 20% over the course of 2020.

Following is a look at the seven product categories for which the U.S. PIRG Education Fund found more than half of the product listings increased in price by more than 20%.

Pulse oximeters

pulse oximeter
Click and Photo / Shutterstock.com

Pulse oximeters measure the oxygen level in a person’s blood.

The U.S. PIRG Education Fund found that 54% of listings for pulse oximeters on Amazon that it examined increased in price by more than 20% in 2020 — and 5% of those listings at least doubled in price.

Hand soaps

Woman washing her hands
Dragana Gordic / Shutterstock.com

In 2020, 59% of Amazon listings for this anti-COVID-19 essential increased in price by more than 20%, and 11% of those at least doubled in price, according to the U.S. PIRG Education Fund analysis. The nonprofit also found one instance in which a three-pack of hand soap increased in price from $25.57 to $72.94.

Perhaps not surprisingly, soap is among the pandemic must-haves that Money Talks News cites in “20 Things That Are Actually Worth Stockpiling.”

Oral thermometers

Sick woman holding thermometer
Hananeko_Studio / Shutterstock.com

The U.S. PIRG Education Fund discovered that 59% of Amazon listings for these fever-detectors that the nonprofit examined increased in price by more than 20% in 2020, and nearly one-quarter at least doubled in price. One thermometer’s price rose from $254.78 to $401.76.

If you want to go different routes in measuring your family’s temperatures, The New York Times’ Wirecutter reviews in-ear and forehead thermometers.

Patio heaters

Patio heater
Pawel Pietraszewski / Shutterstock.com

These handy products greatly enhance outdoor gatherings, and the U.S. PIRG Education Fund found that 61% of examined Amazon listings for these heaters increased in price by more than 20%, and 45% at least doubled in price in 2020.

If a patio heater isn’t your style, AARP has some ideas to stay warm outside during a time when meeting up indoors can be risky.

Cloth face masks

Woman in a mask shopping for groceries
Paulo Vilela / Shutterstock.com

In 2020, 66% of the Amazon listings for cloth face masks in the U.S. PIRG Education Fund’s analysis increased in price by at least 20%.

Increasingly more health experts are advising people to wear two masks, and Money Talks News breaks down the pros and cons of doubling up in “Does Wearing 2 Masks Protect You Better From COVID-19?

Hand sanitizers

Parent and child use hand sanitizer and face masks at school
1641857584 / Shutterstock.com

The U.S. PIRG Education Fund found that 77% of the Amazon listings for hand sanitizers that it examined increased in price by more than 20% in 2020, with nearly a quarter of those doubling in price. One hand sanitizer’s price rose from $33.13 to $178.20.

If you want to save some money and DIY your sanitizer, Money Talks News has instructions for making your own.

Disinfectant wipes

Woman using a disinfecting wipe to clean a door handle
FotoHelin / Shutterstock.com

In 2020, 78% of the Amazon listings for disinfectant wipes increased in price by at least 20%, according to the U.S. PIRG Education Fund analysis.

Despite their popularity, wipes are not the only way to kill coronavirus germs. Money Talks News details some cheaper options in “5 Cleaning Products You Should Be Using in 2021.”

Disclosure: The information you read here is always objective. However, we sometimes receive compensation when you click links within our stories.

10 Cities Expected to Attract Millennial Homebuyers in 2021

young homebuyers first houseyoung homebuyers first house
Rocketclips, Inc. / Shutterstock.com

This story originally appeared on SmartAsset.com.

The homeownership rate in America peaked at a little more than 69% in 2004 before falling to 63.7% in 2016, according to U.S. Census Bureau data. Despite the fact that it rebounded to a little more than 65% in 2019 overall, only 36.4% of Americans younger than 35 own their homes.

It may be easier in some places, though, for this younger cohort to buy homes. To that end, SmartAsset crunched the numbers to find the cities where people younger than the age of 35 are most likely to own their own home — and to see where this number has gone up in recent years.

To find the cities where more under-35 residents are buying homes, we compared the homeownership rate for this demographic in 2009 with the homeownership rate in 2019 for 200 of the largest U.S. cities. For details on our data sources and how we put all the information together to create our final rankings, check out the Data and Methodology section at the end.

1. Midland, TX

Midland, Texas skylineMidland, Texas skyline
NaturallyKristina / Shutterstock.com

Midland, Texas, has seen a 10-year increase of 17.11 percentage points in the homeownership rate among people younger than 35, the largest growth seen in this study. The total homeownership rate for that age cohort in 2019 was 52.42%, the fourth-highest rate we found for that metric. Together, this makes Midland the top place where more young residents are buying homes.

2. Cape Coral, FL

Cape Coral FloridaCape Coral Florida
mginley / Shutterstock.com

The homeownership for younger Cape Coral, Florida, residents in 2019 was 55.54%, the third-highest rate in the study for this metric. That’s an increase of 8.71 percentage points compared with 2009, and the fourth-highest increase for this metric across all 200 cities we considered.

3. Joliet, IL

Joliet IllinoisJoliet Illinois
Henryk Sadura / Shutterstock.com

Joliet, Illinois, located about 30 miles southwest of Chicago, had a homeownership rate of 63.48% for under-35 residents in 2019, the highest rate of all the cities we studied. Joliet ranks ninth for the 10-year change in homeownership, increasing 5.48 percentage points from its 2009 rate of 58.00%.

4. Mesquite, TX

Mesquite TexasMesquite Texas
mivod / Shutterstock.com

Mesquite, Texas, is part of the Dallas metro area, and in 2019 the homeownership rate there among residents younger than 35 was 45.46%, ranking it 11th in our study. But in 2009 the rate was just 35.47%, meaning the increase over 10 years was 9.99 percentage points, third-place for this metric.

5. Bakersfield, CA

Bakersfield, CaliforniaBakersfield, California
Richard Thornton / Shutterstock.com

Bakersfield, in central California, ranks 20th for homeownership rate among younger people in 2019, at 39.75%. That’s a 10.01 percentage point increase over the 10-year period from 2009 to 2019, the second-highest jump for this metric in the study.

6. Aurora, CO (tied)

Aurora ColoradoAurora Colorado
Arina P Habich / Shutterstock.com

Aurora, Colorado, ranks 15th for the 2019 homeownership rate among people younger than 35, at 42.28%. That is an increase of 5.29 percentage points from 2009, the 10th-largest jump we observed in the study.

6. Port St. Lucie, FL (tied)

Port St Lucie FloridaPort St Lucie Florida
Felix Mizioznikov / Shutterstock.com

Port St. Lucie, Florida, has the fifth-highest homeownership rate among younger people in 2019, at 51.93%. It ranks 20th for its 2.70-point increase in that percentage from 2009.

8. Gilbert, AZ

Gilbert, ArizonaGilbert, Arizona
Tim Roberts Photography / Shutterstock.com

Gilbert, Arizona, located near Phoenix, has the eighth-highest homeownership rate among residents younger than 35, at 50.08%. That was an increase of 2.69 percentage points since 2009, good enough for 21st place in that metric.

9. Fort Wayne, IN

Fort Wayne IndianaFort Wayne Indiana
Travis Eckert / Shutterstock.com

Fort Wayne, Indiana, ranked 17th in both of the metrics we measured for this study. The homeownership rate among those younger than 35 was 41.24% in 2019, a 3.32 percentage point increase over the previous 10 years.

10. Rancho Cucamonga, CA

Rancho Cucamonga CaliforniaRancho Cucamonga California
Tim Gray / Shutterstock.com

The final city in the top 10 of this study is Rancho Cucamonga, California, which ranked 21st for under-35 homeownership in 2019, at 39.39%. That is a 3.77 percentage point jump since 2009, the 14th-biggest increase we observed across all 200 cities in the study.

Data and Methodology

Happy couple buying a home in a new cityHappy couple buying a home in a new city
Monkey Business Images / Shutterstock.com

To find the cities where more young Americans are buying homes, SmartAsset examined data for 200 of the largest cities in the U.S. We considered two metrics:

  • 2019 homeownership rate for those under 35. This is the homeownership rate among 18- to 34-year-olds. Data comes from the U.S. Census Bureau’s 2019 1-year American Community Survey.
  • 10-year change in the homeownership rate for those under 35. This compares the homeownership rate among 18- to 34-year-olds in 2009 with the rate in 2019. Data comes from the U.S. Census Bureau’s 2009 and 2019 1-year American Community Surveys.

First, we ranked each city in both metrics. Then we found each city’s average ranking and used the average to determine a final score. The city with the highest average ranking received a score of 100. The city with the lowest average ranking received a score of 0.

Disclosure: The information you read here is always objective. However, we sometimes receive compensation when you click links within our stories.